Flow
Limit work in progress, ship more.
Track how many items your team is working on simultaneously. Reduce context switching and improve focus.
Focus Metrics
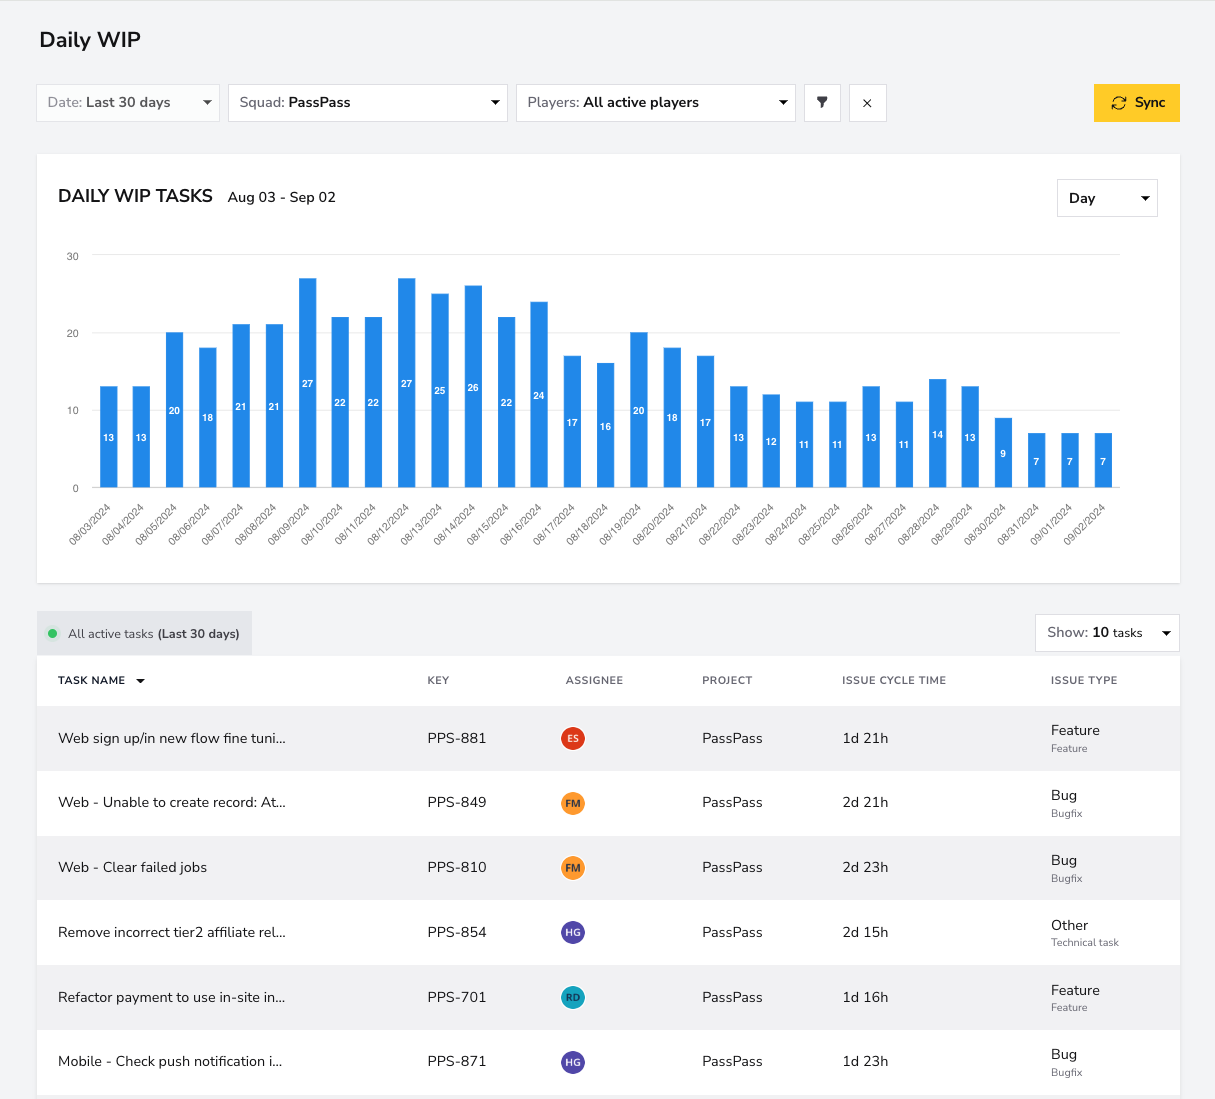
See how much work is in flight
Track the number of issues and PRs in progress at any given time across your team.
- Daily snapshot of active work items
- WIP limits by team and individual
- Historical WIP trend charts
Focus Metrics
Context Switching
Reduce multitasking overhead
High WIP correlates with slower delivery. See the relationship between WIP and cycle time in your data.
- WIP vs. cycle time correlation
- Individual developer WIP tracking
- Alert when WIP exceeds threshold
Context Switching
Team Alpha1.8d
Team Beta3.2d
Team Gamma2.4d
Team Delta4.1d
Flow Efficiency
Maximize flow efficiency
Measure the ratio of active work time to total time. Optimize for flow, not just activity.
- Flow efficiency percentage
- Active vs. waiting time breakdown
- Team-level flow optimization
Flow Efficiency
Improved
On track
Needs attention
3.2
Optimal WIP per developer
35%
Less context switching
2x
Faster task completion