What is the Claude Activity report?
The Claude Activity report shows usage and adoption metrics from your connected Claude organization. Use it to understand Claude Code activity, tool acceptance, and usage patterns across players.
Open the report from DevEx > Claude Activity.
Before you start
Connect a Claude organization and wait for its initial synchronization to finish. If no organization is connected or synchronization is still running, DevStats redirects you to the Claude integration setup. See Claude integration.
The report layout depends on the connected account type:
- Console: Claude Code overview, tool acceptance, model and terminal breakdowns, token usage, and a Players table.
- Enterprise: Claude Code metrics, Chat & Cowork activity, adoption panels, and a Players table with a product filter.
These are account-specific layouts, not tabs you switch between within the report.
Filters and chart controls
Use Date to choose the reporting period and Players to focus on selected people. Users with permission to view Settings can open Edit Integration from the report.
Select a metric card to update its related chart. Chart controls let you change the visualization and time grouping.
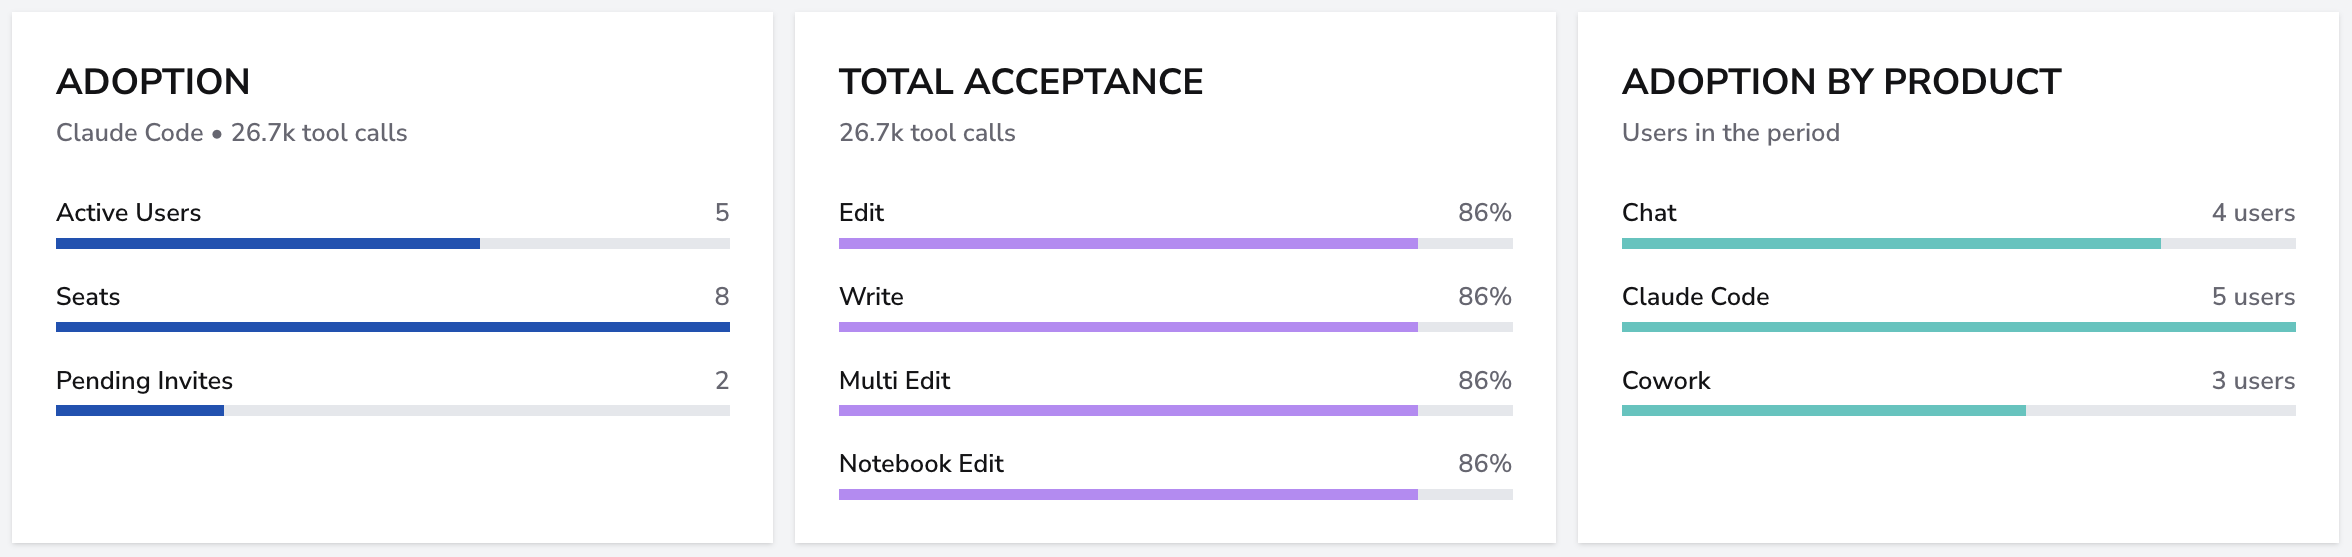
Enterprise adoption counts are organization-wide snapshots within the selected date range. The player filter does not narrow seat counts, pending invites, or Adoption by Product.
Console account
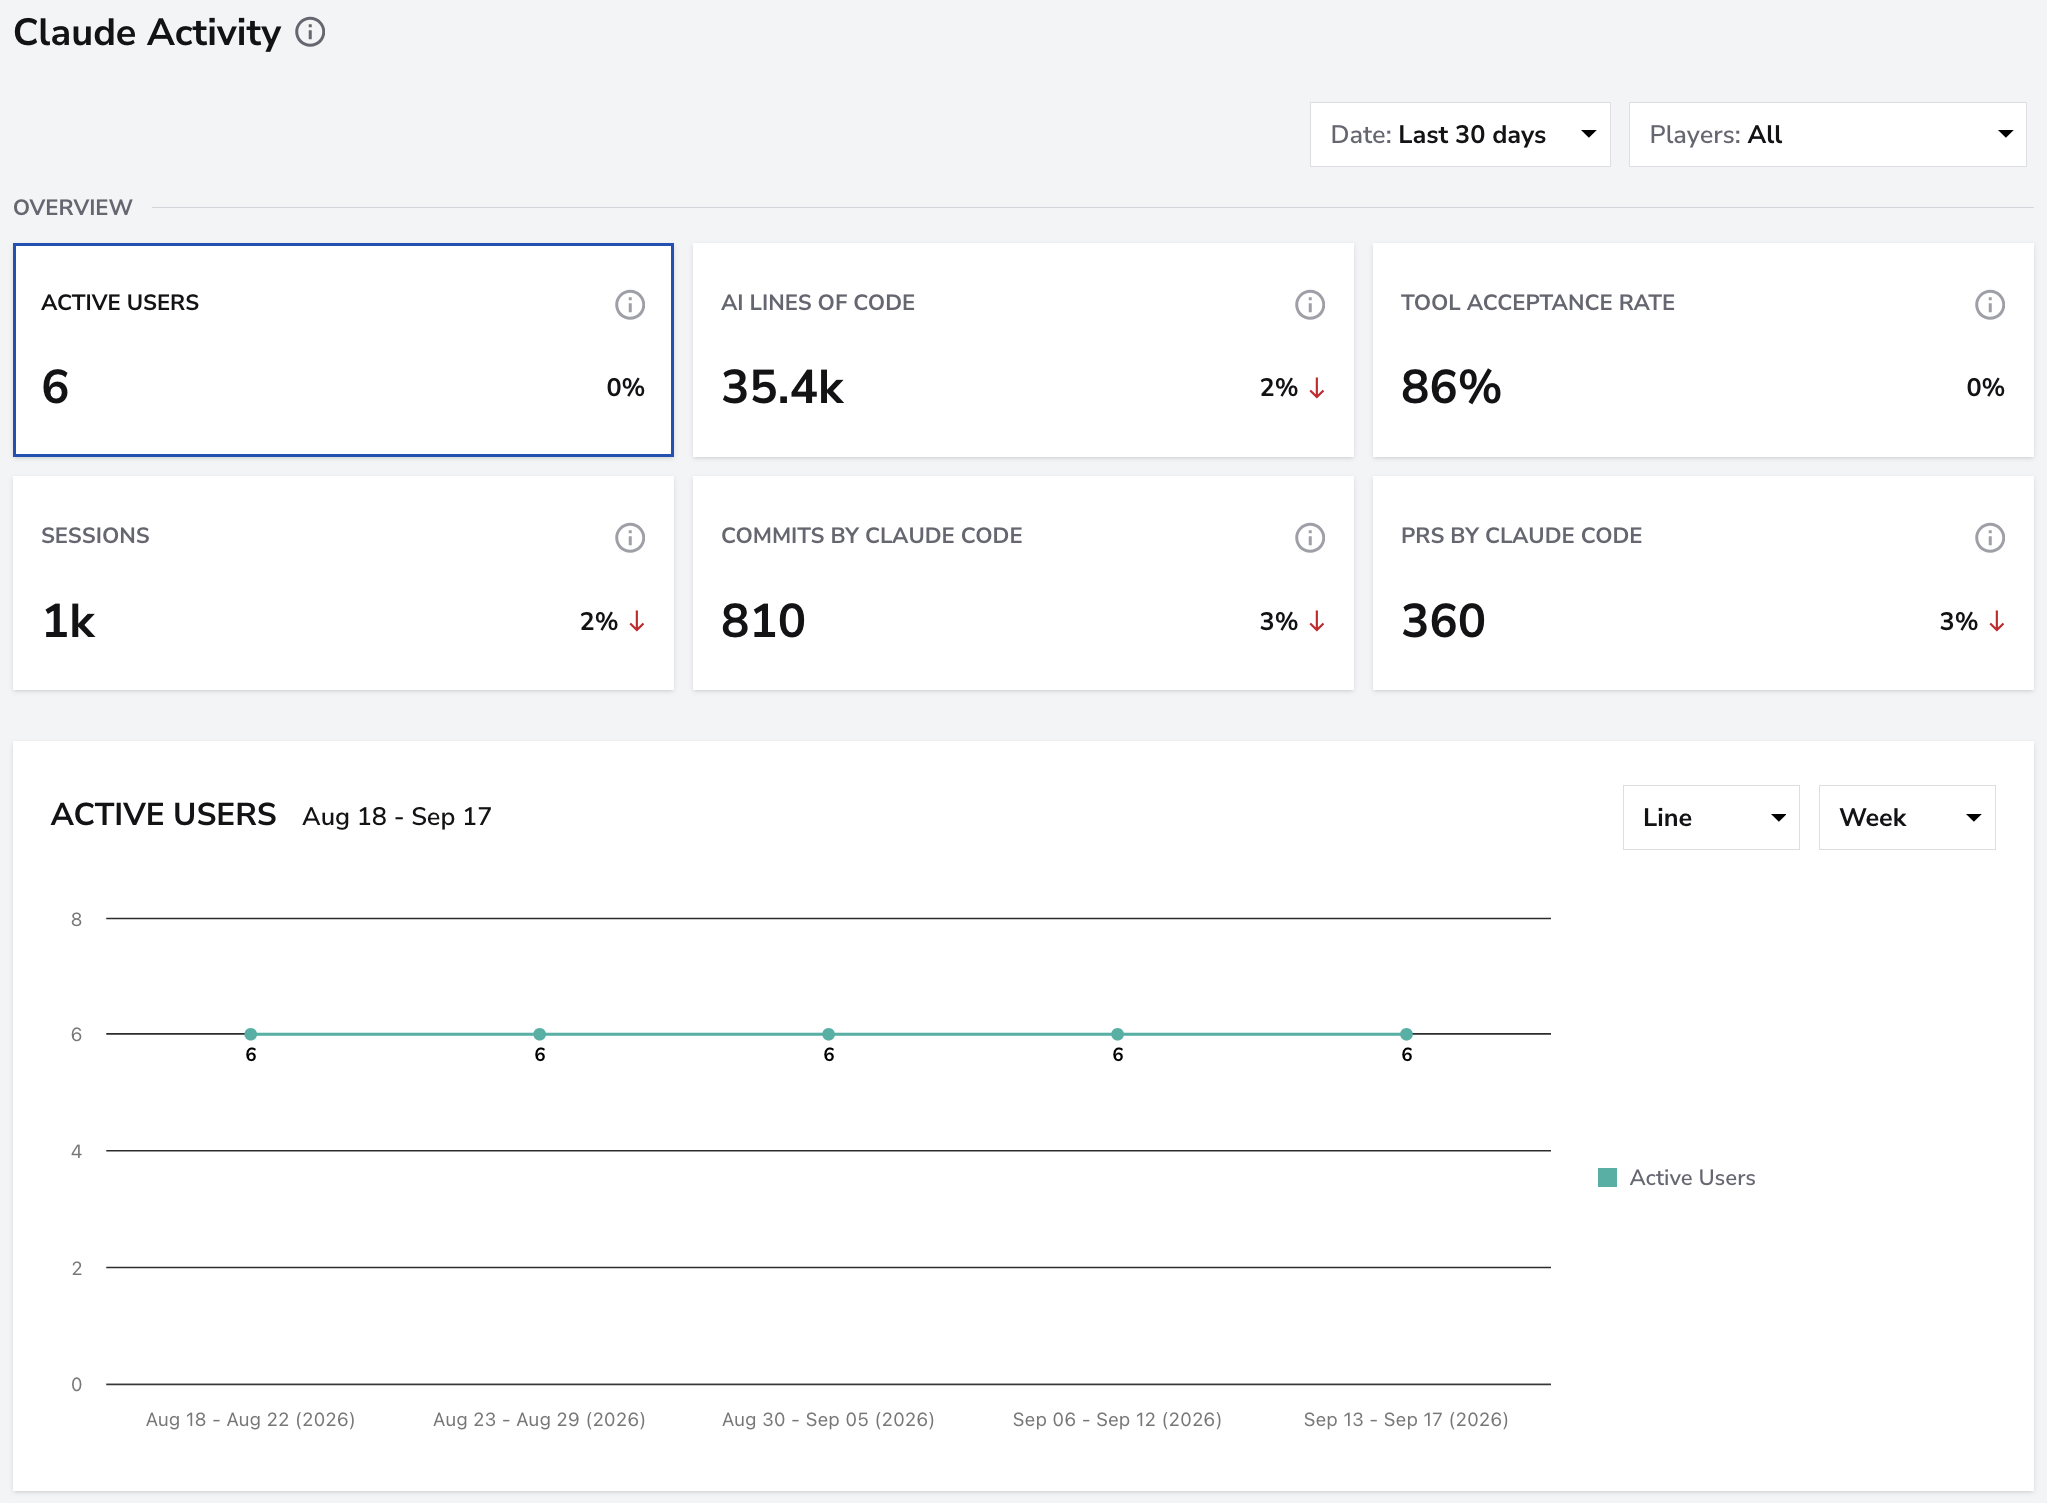
Overview
The Console layout includes six selectable metrics:
- Active Users: distinct players with synced Claude activity records in the selected period.
- AI Lines of Code: lines added plus lines deleted with Claude Code.
- Tool Acceptance Rate: accepted tool calls divided by accepted plus rejected tool calls, expressed as a percentage.
- Sessions: Claude Code sessions recorded in the selected period.
- Commits by Claude Code: recorded commits attributed to Claude Code.
- PRs by Claude Code: recorded pull requests attributed to Claude Code.
Selecting a card updates the overview chart.
Usage breakdowns
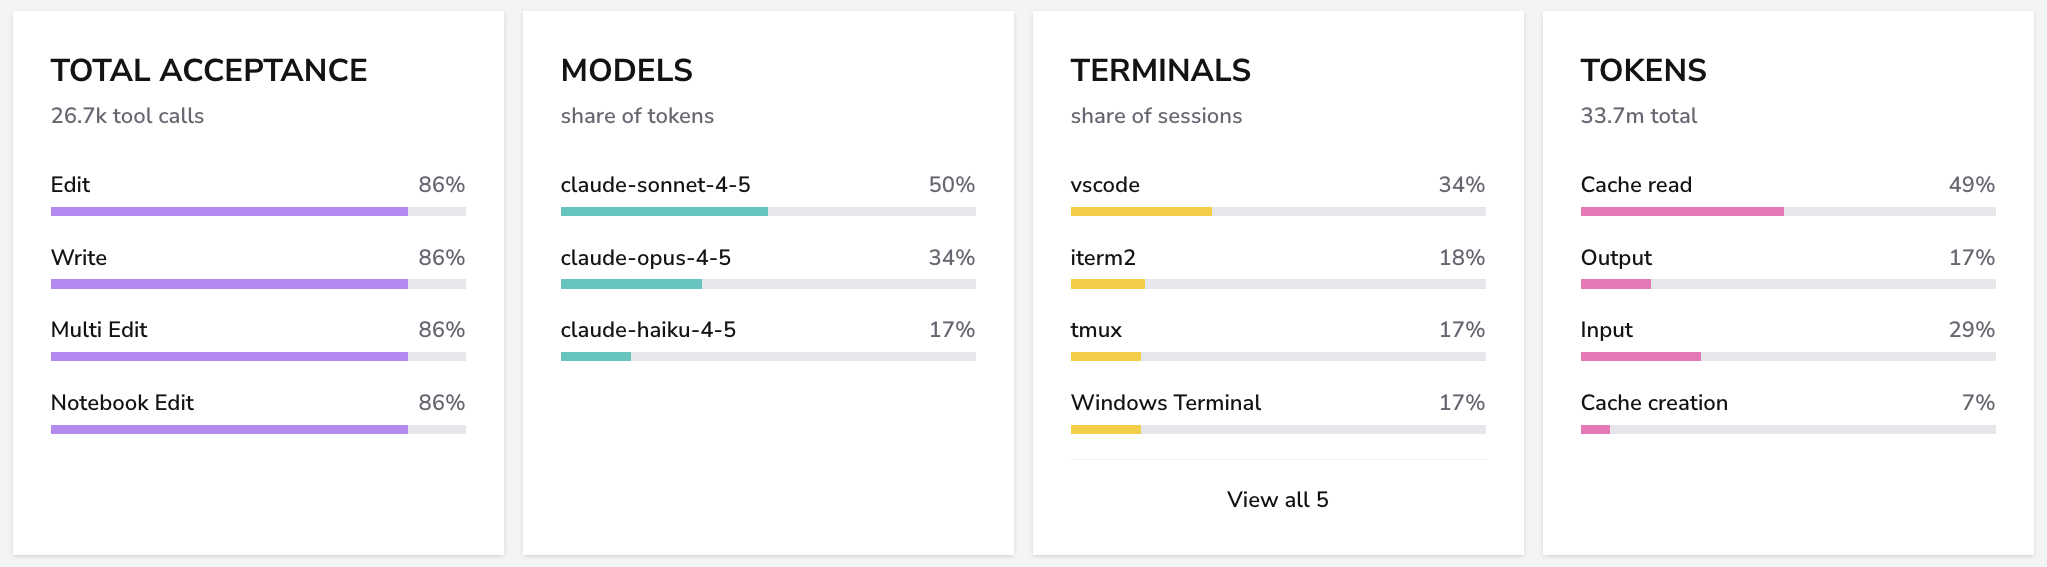
- Total Acceptance: acceptance rate for each tool: Edit, Write, Multi Edit, and Notebook Edit. The panel also shows the total number of accepted and rejected tool calls.
- Models: each model's share of token usage, including input, output, cache read, and cache creation tokens.
- Terminals: each terminal's share of recorded sessions.
- Tokens: total token usage and its distribution across Cache read, Output, Input, and Cache creation.
Models and Terminals display up to four entries initially. Use View All, when available, to open the full breakdown.
Players table
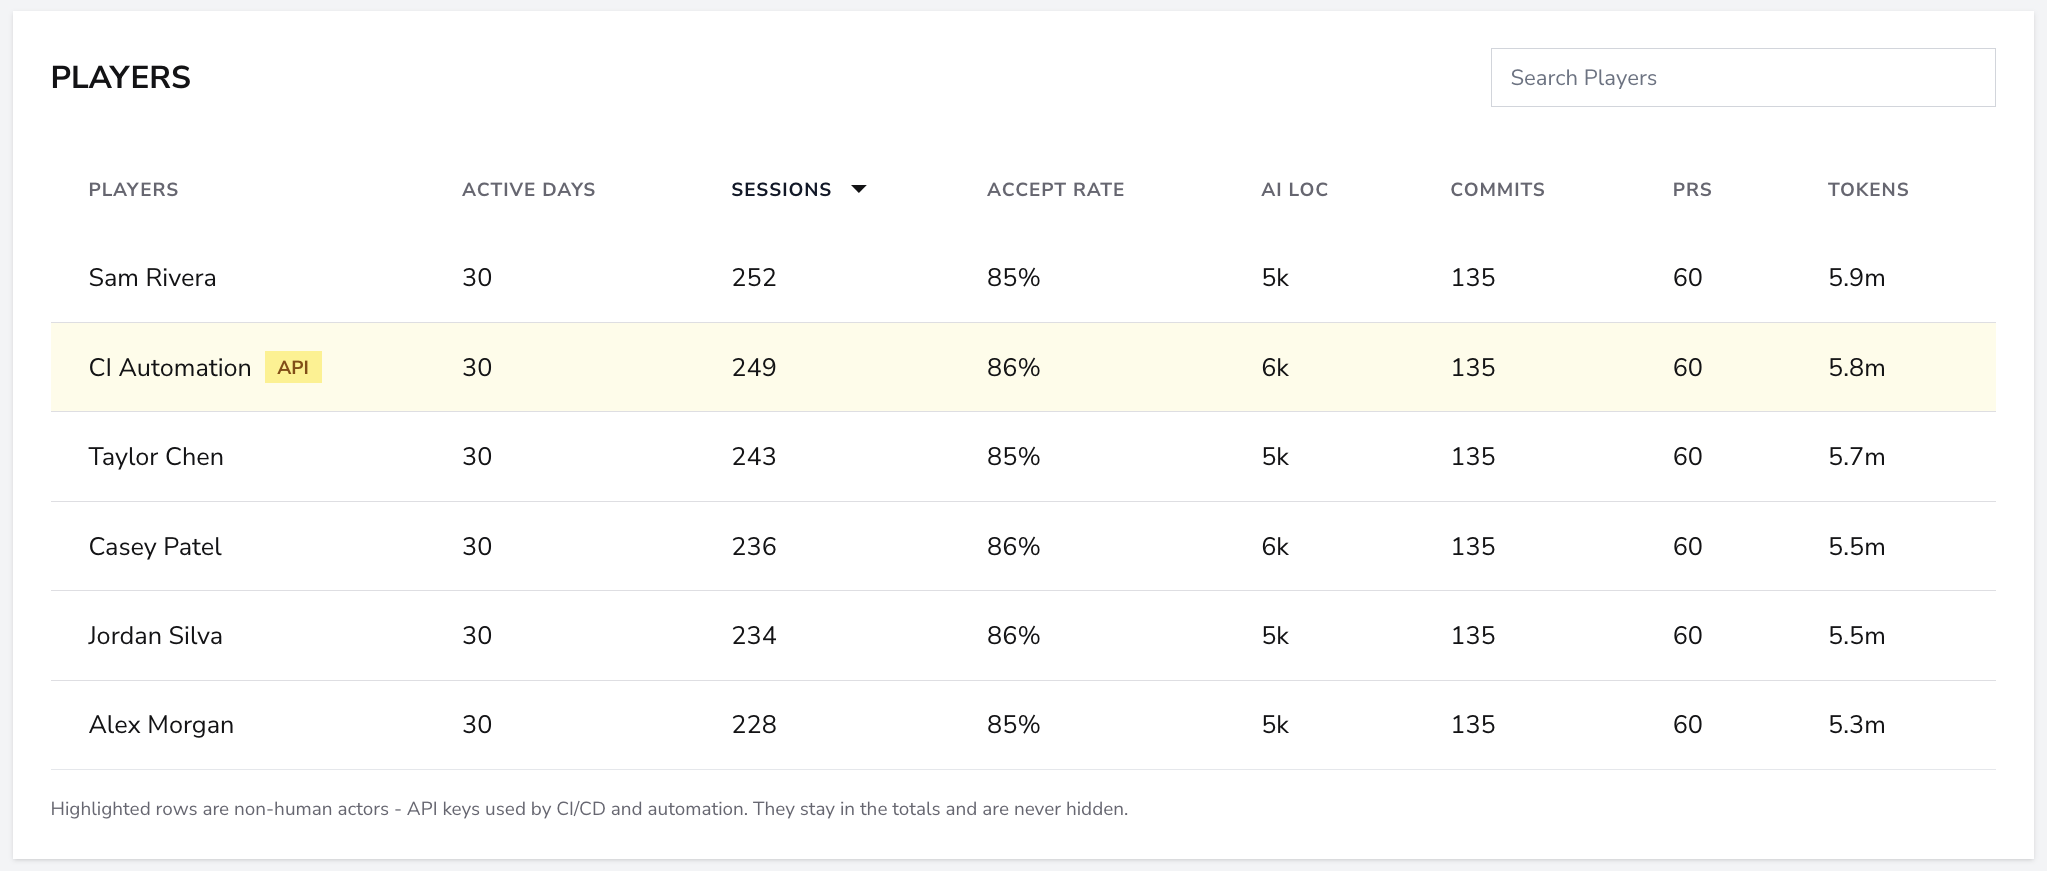
The table includes Players, Active Days, Sessions, Accept Rate, AI LOC, Commits, PRs, and Tokens. Use search and column sorting to inspect activity by player.
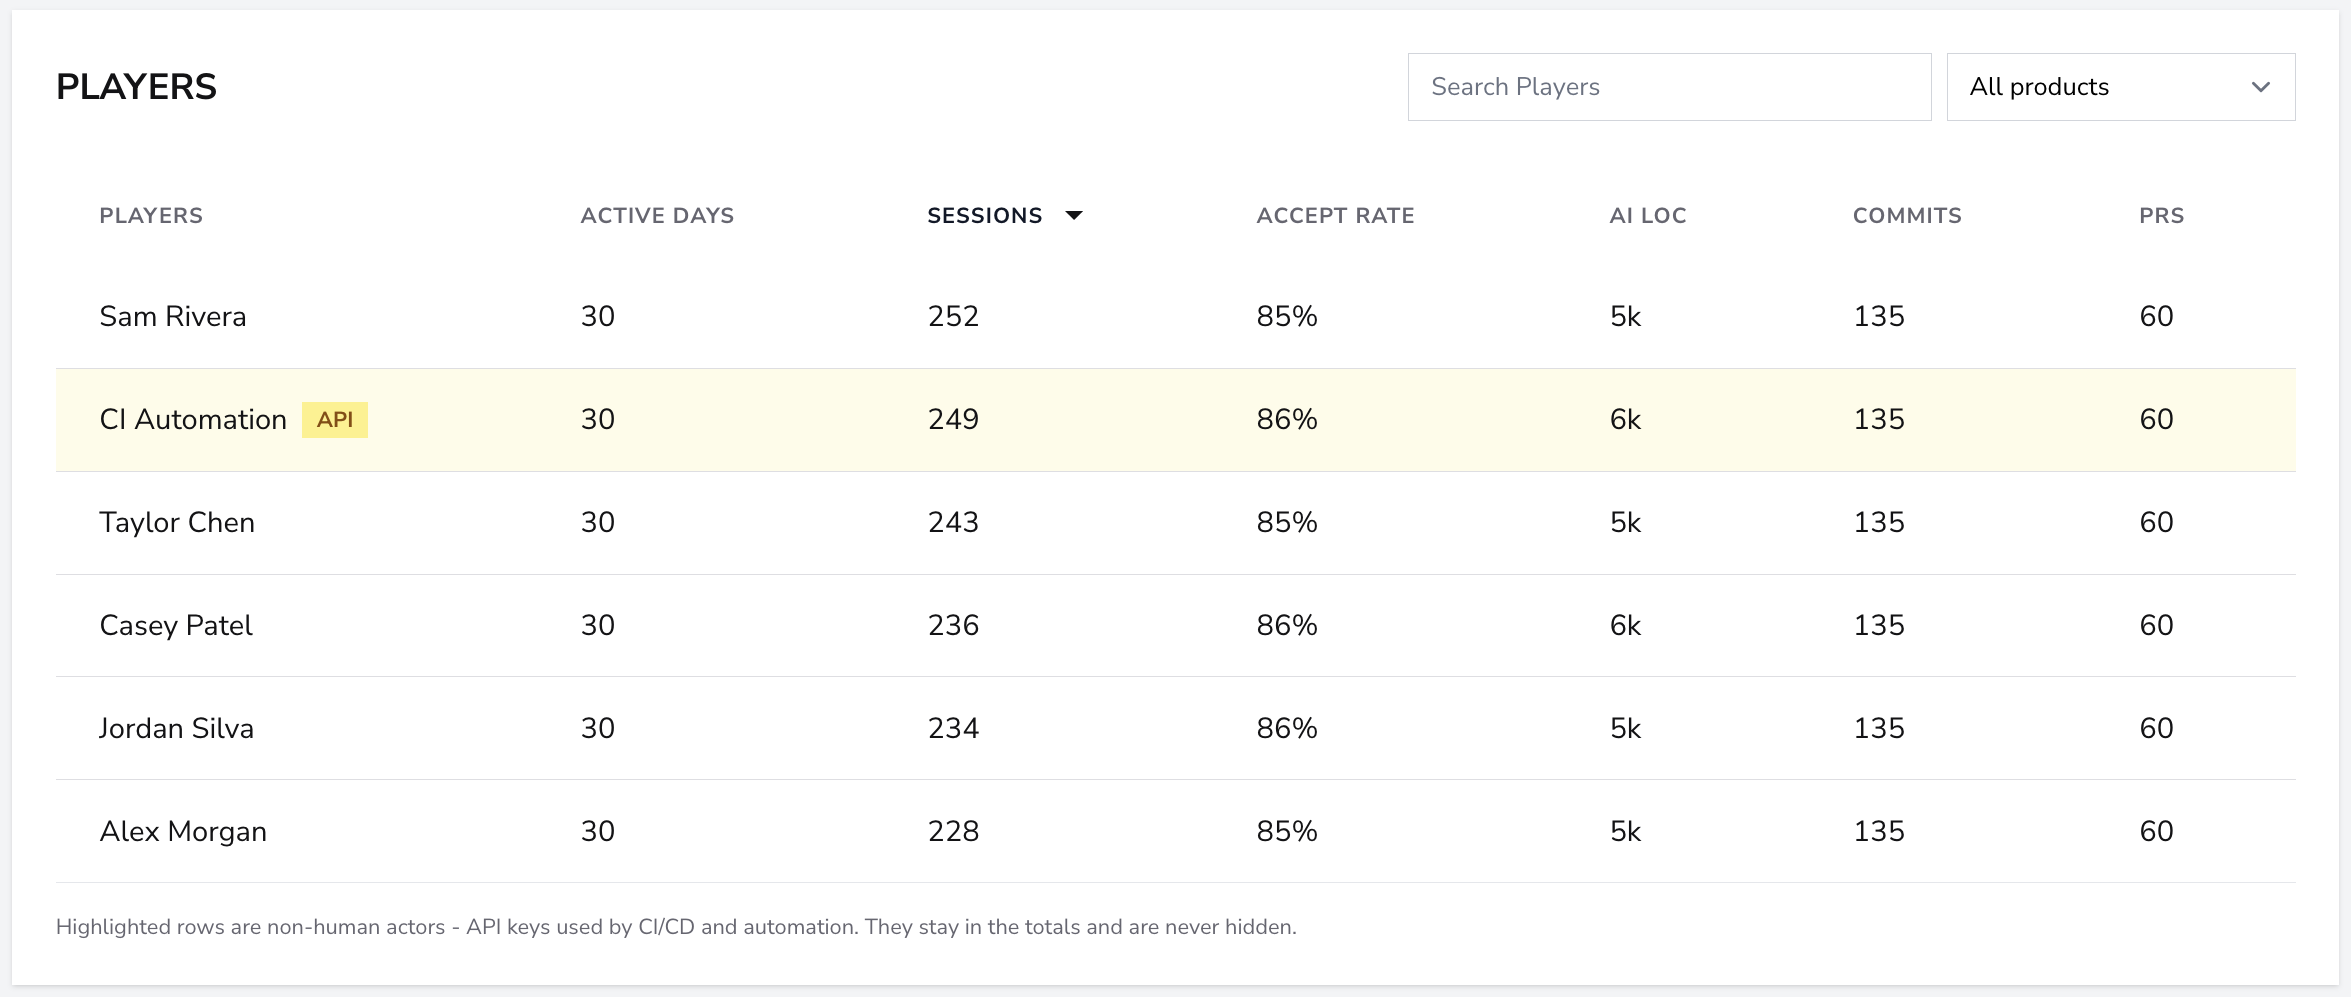
Highlighted rows with an API badge represent non-human actors, such as API keys used by CI/CD or automation. Their activity remains included in totals.
Enterprise account
Claude Code
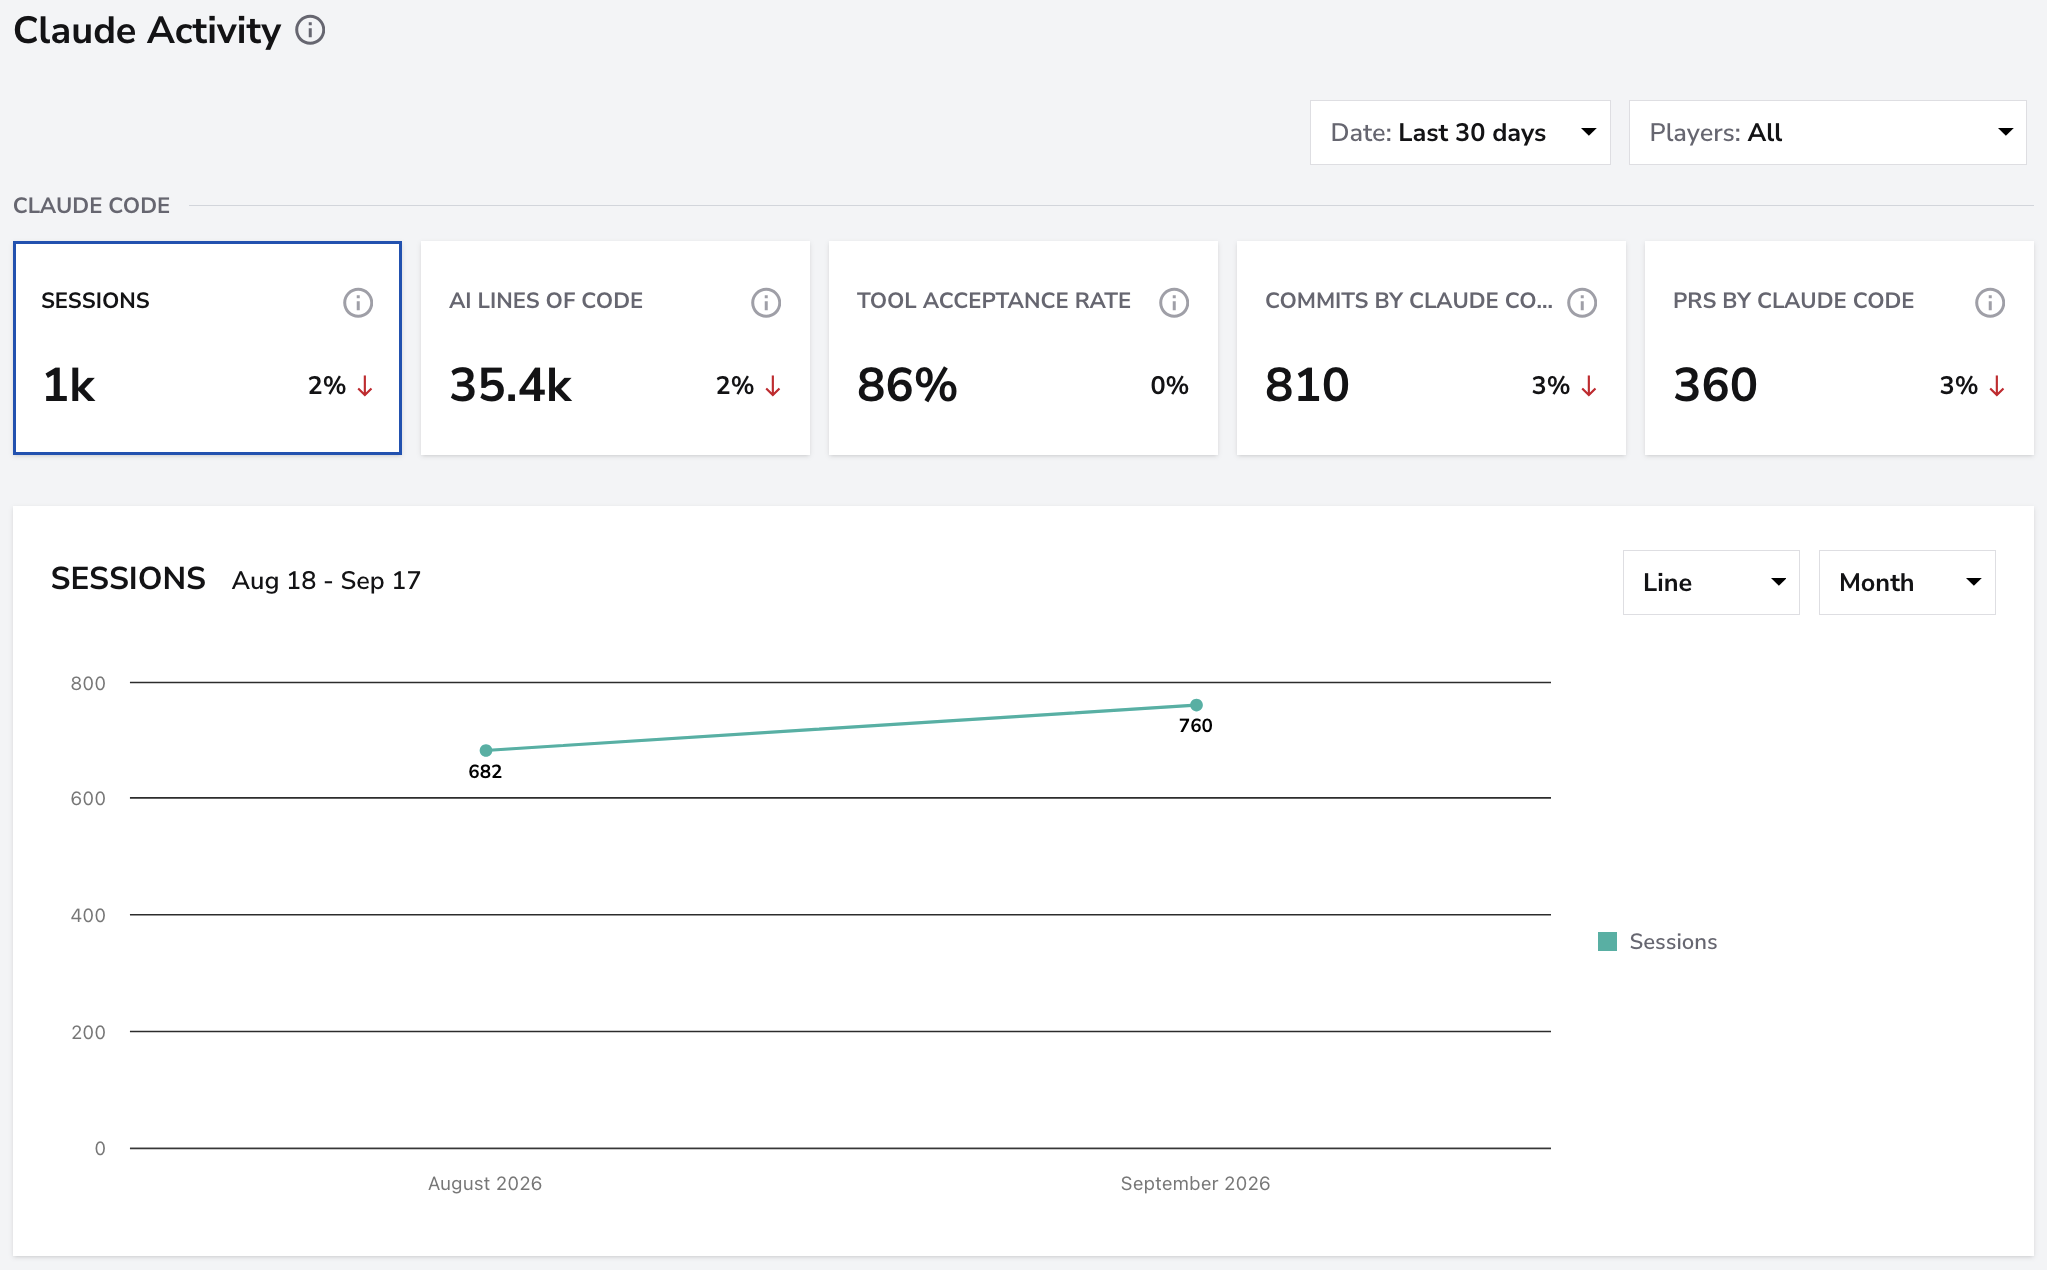
The Enterprise layout includes Sessions, AI Lines of Code, Tool Acceptance Rate, Commits by Claude Code, and PRs by Claude Code. These metrics have the same definitions as the Console overview. Select a card to update the Claude Code chart.
Chat & Cowork
This section adds two selectable metrics with their own chart:
- Chat messages: recorded Claude chat messages in the selected period.
- Cowork sessions: recorded Cowork sessions in the selected period.

Adoption panels
- Adoption: Active Users, Seats, and Pending Invites from the latest organization snapshot in the selected period. Bars compare the counts with assigned seats. If seat information is missing or zero, the panel displays no data. Its tool-call total follows the selected players.
- Total Acceptance: acceptance rates for Edit, Write, Multi Edit, and Notebook Edit, alongside the total tool-call count.
- Adoption by Product: user counts for Chat, Claude Code, and Cowork from the latest available record for each product in the selected period. Bar lengths are relative to the product with the highest count; they are not shares that add up to 100%.
Players table
The Enterprise table includes Players, Active Days, Sessions, Accept Rate, AI LOC, Commits, and PRs.
Use search, column sorting, and All products to inspect the table. Selecting Chat, Claude Code, or Cowork limits the rows to players with recorded activity in that product; it does not switch the other report panels.
As in the Console layout, highlighted API rows represent non-human actors and remain included in totals.
How to interpret the report
Use these metrics to investigate adoption and workflow patterns. Tool acceptance measures accepted tool calls, not the correctness of the resulting code. AI lines of code include additions and deletions, so they are not net code growth.
Higher activity, more tokens, or more sessions do not by themselves establish better productivity or delivery performance. Read Claude Activity alongside delivery and quality metrics.