Benchmarks Dashboard Overview
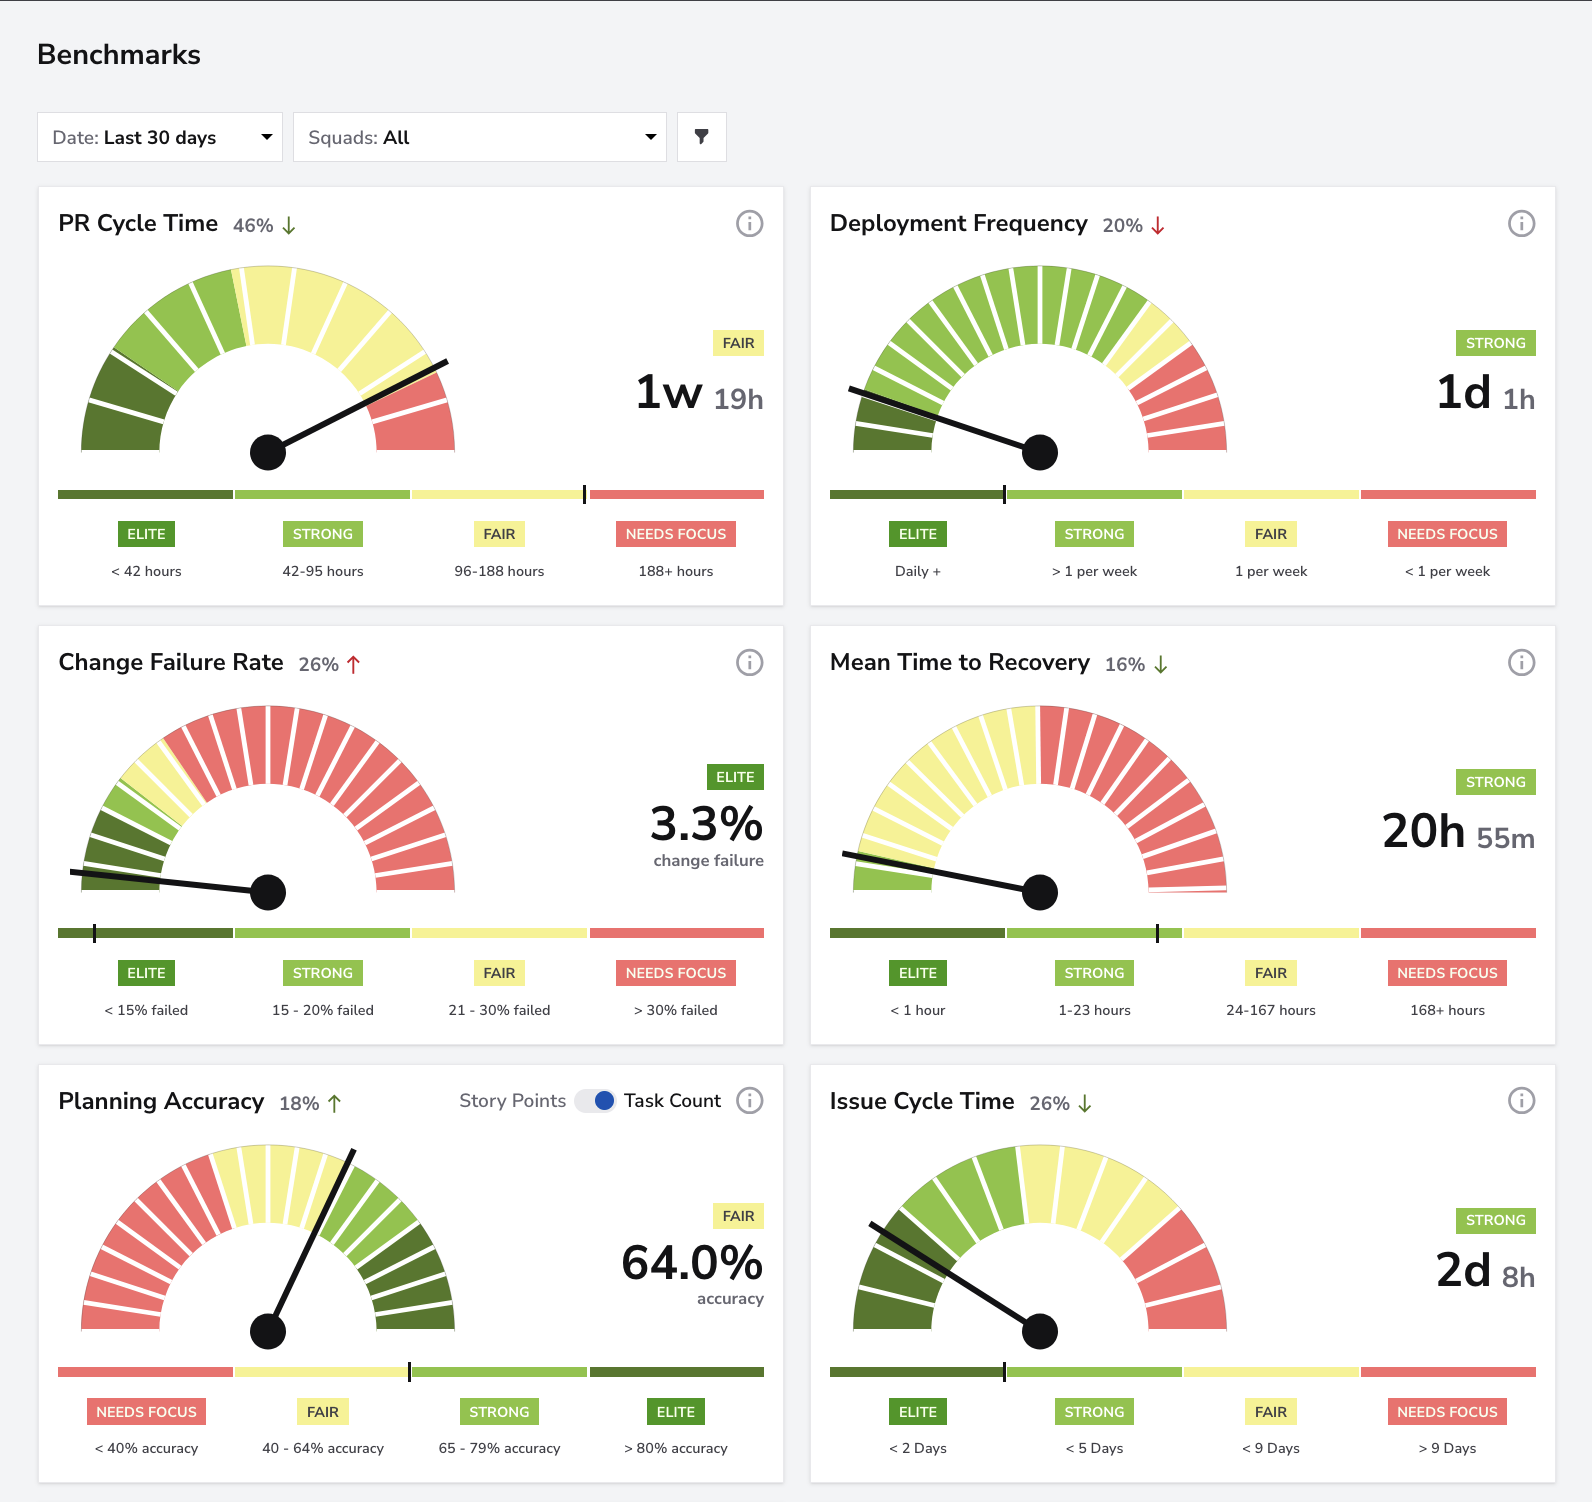
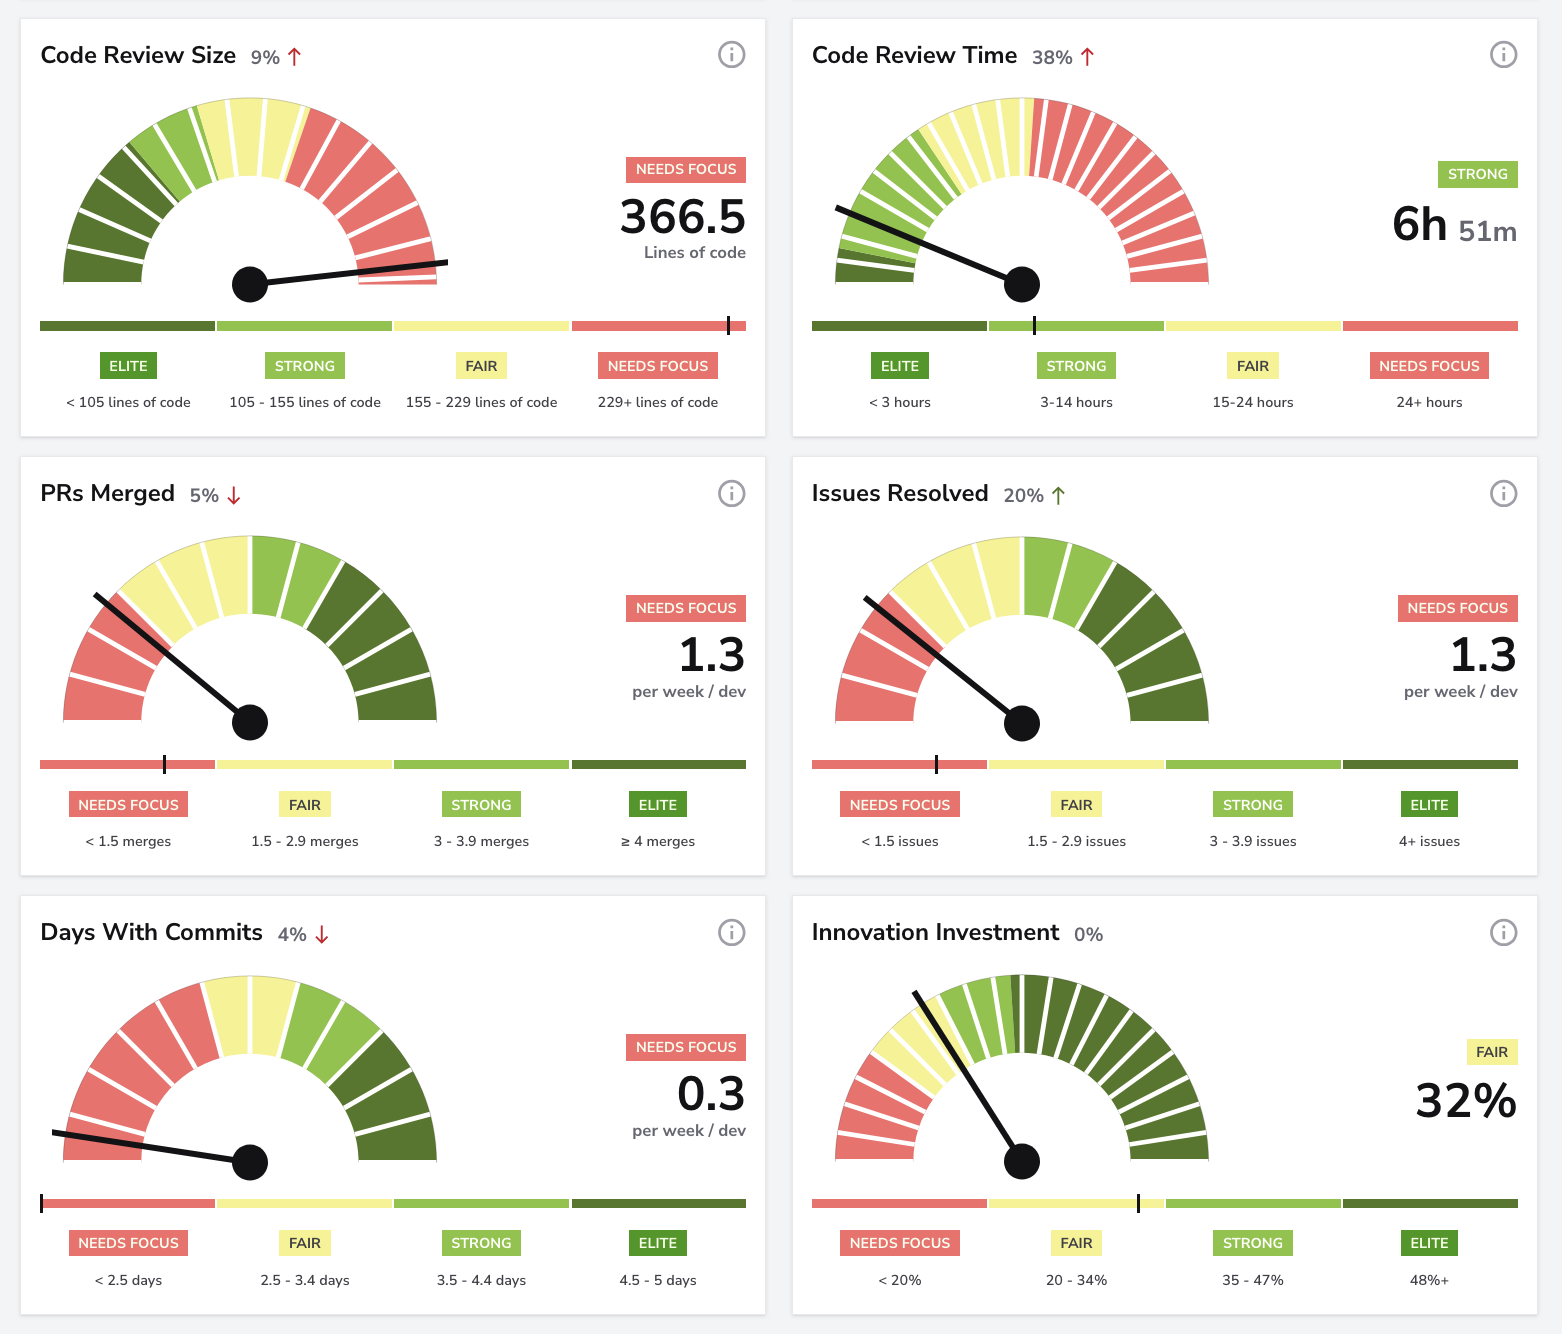
The Benchmarks Dashboard provides a snapshot of your team’s performance across 12 metrics tracked by DevStats. Each card uses the Elite, Strong, Fair, and Needs Focus tiers to show where performance stands and where improvement may have the most impact.
The dashboard includes PR Cycle Time, Deployment Frequency, Change Failure Rate, Mean Time to Recovery, Planning Accuracy, Issue Cycle Time, Code Review Size, Code Review Time, PRs Merged, Issues Resolved, Days With Commits, and Innovation Investment. Cards use data from the relevant Git provider or project management integration; when a required source is unavailable, DevStats displays sample data instead.
Metrics
PR Cycle Time
- What it measures: The average time for a pull request to progress from creation to deployment.
- What to look for: Elite: under 42 hours. Strong: 42–95 hours. Fair: 96–188 hours. Needs Focus: over 188 hours.
- Learn more: PR Cycle Time.
Deployment Frequency
- What it measures: How often your team deploys code to production.
- What to look for: Elite: daily or more often. Strong: more than once per week. Fair: once per week. Needs Focus: less than once per week.
- Learn more: Deployment Frequency.
Change Failure Rate
- What it measures: The percentage of deployments that cause a production failure requiring remediation.
- What to look for: Elite: under 15%. Strong: 15–20%. Fair: 21–30%. Needs Focus: over 30%.
- Learn more: Tracking Incidents.
Mean Time to Recovery
- What it measures: The average time required to restore service after a production failure.
- What to look for: Elite: under 1 hour. Strong: 1–23 hours. Fair: 24–167 hours. Needs Focus: 168 hours or more.
- Learn more: DORA Metrics.
Planning Accuracy
- What it measures: The percentage of planned sprint work that was completed.
- What to look for: Elite: 80% or more. Strong: 65–79%. Fair: 40–64%. Needs Focus: under 40%.
- Learn more: Planning Accuracy.
Issue Cycle Time
- What it measures: The time an issue spends in progress before it is resolved.
- What to look for: Elite: up to 2 days. Strong: over 2 and under 5 days. Fair: 5 to under 9 days. Needs Focus: 9 days or more.
- Learn more: Issue Cycle Time.
Code Review Size
- What it measures: The average number of lines of code included in pull requests under review.
- What to look for: Elite: under 105 lines. Strong: 105–154 lines. Fair: 155–228 lines. Needs Focus: 229 lines or more.
- Learn more: Code Review.
Code Review Time
- What it measures: The average time pull requests spend in code review before being merged.
- What to look for: Elite: under 3 hours. Strong: 3–14 hours. Fair: 15–24 hours. Needs Focus: over 24 hours.
- Learn more: Code Review.
PRs Merged
- What it measures: The average number of pull requests merged per week and per developer.
- What to look for: Elite: 4 or more. Strong: 3–3.9. Fair: 1.5–2.9. Needs Focus: under 1.5.
- Learn more: Throughput.
Issues Resolved
- What it measures: The average number of issues resolved per week and per developer.
- What to look for: Elite: 4 or more. Strong: 3–3.9. Fair: 1.5–2.9. Needs Focus: under 1.5.
- Learn more: Productivity.
Days With Commits
- What it measures: The average number of days per week with at least one commit, calculated per developer.
- What to look for: Elite: 4.5–5 days. Strong: 3.5–4.4 days. Fair: 2.5–3.4 days. Needs Focus: under 2.5 days.
- Learn more: Productivity.
Innovation Investment
- What it measures: The percentage of developer time spent on work classified as New Things in Engineering Investment.
- What to look for: Elite: 48% or more. Strong: 35–47%. Fair: 20–34%. Needs Focus: under 20%.
- Learn more: Engineering Investment.
Filters
Filter availability depends on your plan:
- Full plans: Date and Squad appear in the main filter bar. Players, Projects, Repositories, and Data Source are available under all filters.
- Benchmark plan: Date, Projects, and Repositories are available. Squad, Players, and Data Source filters are not shown.
Use Reset filters to return to the default selection. The Data Source filter switches supported metrics between Git provider and project management data.
Conclusion
The Benchmarks Dashboard provides a consolidated view of delivery, reliability, planning, review, throughput, and investment performance. Use its tiers and filters to identify strengths, choose improvement priorities, and compare results over time.