What is the Cursor Activity report?
The Cursor Activity report shows Cursor usage, suggestion acceptance, AI code activity, and team adoption. Open it from DevEx > Cursor Activity.
Use it to understand how players use Cursor and investigate changes in their workflows. Activity counts alone do not establish productivity or code quality.
Before you start
Connect Cursor in Settings > Integrations and wait for the initial synchronization. If no organization is connected or synchronization is still running, the report redirects you to the Cursor integration setup.
AI Code in Codebase and the AI LOC Committed table column appear only when AI Code Tracking is enabled for the connected organization. Conversation Insights appears only when that capability is enabled.
Tabs and filters
The report opens on Players. Workspace owners and admins can also open Team.
Both tabs have a Date filter. Players also has a player filter; Team shows organization-level data. Users with permission to view Settings can open Edit Integration from the report.
Select a card in Overview, Requests, or Ecosystem Adoption to update its related chart. Use the available chart controls to change the visualization or time grouping.
Players tab
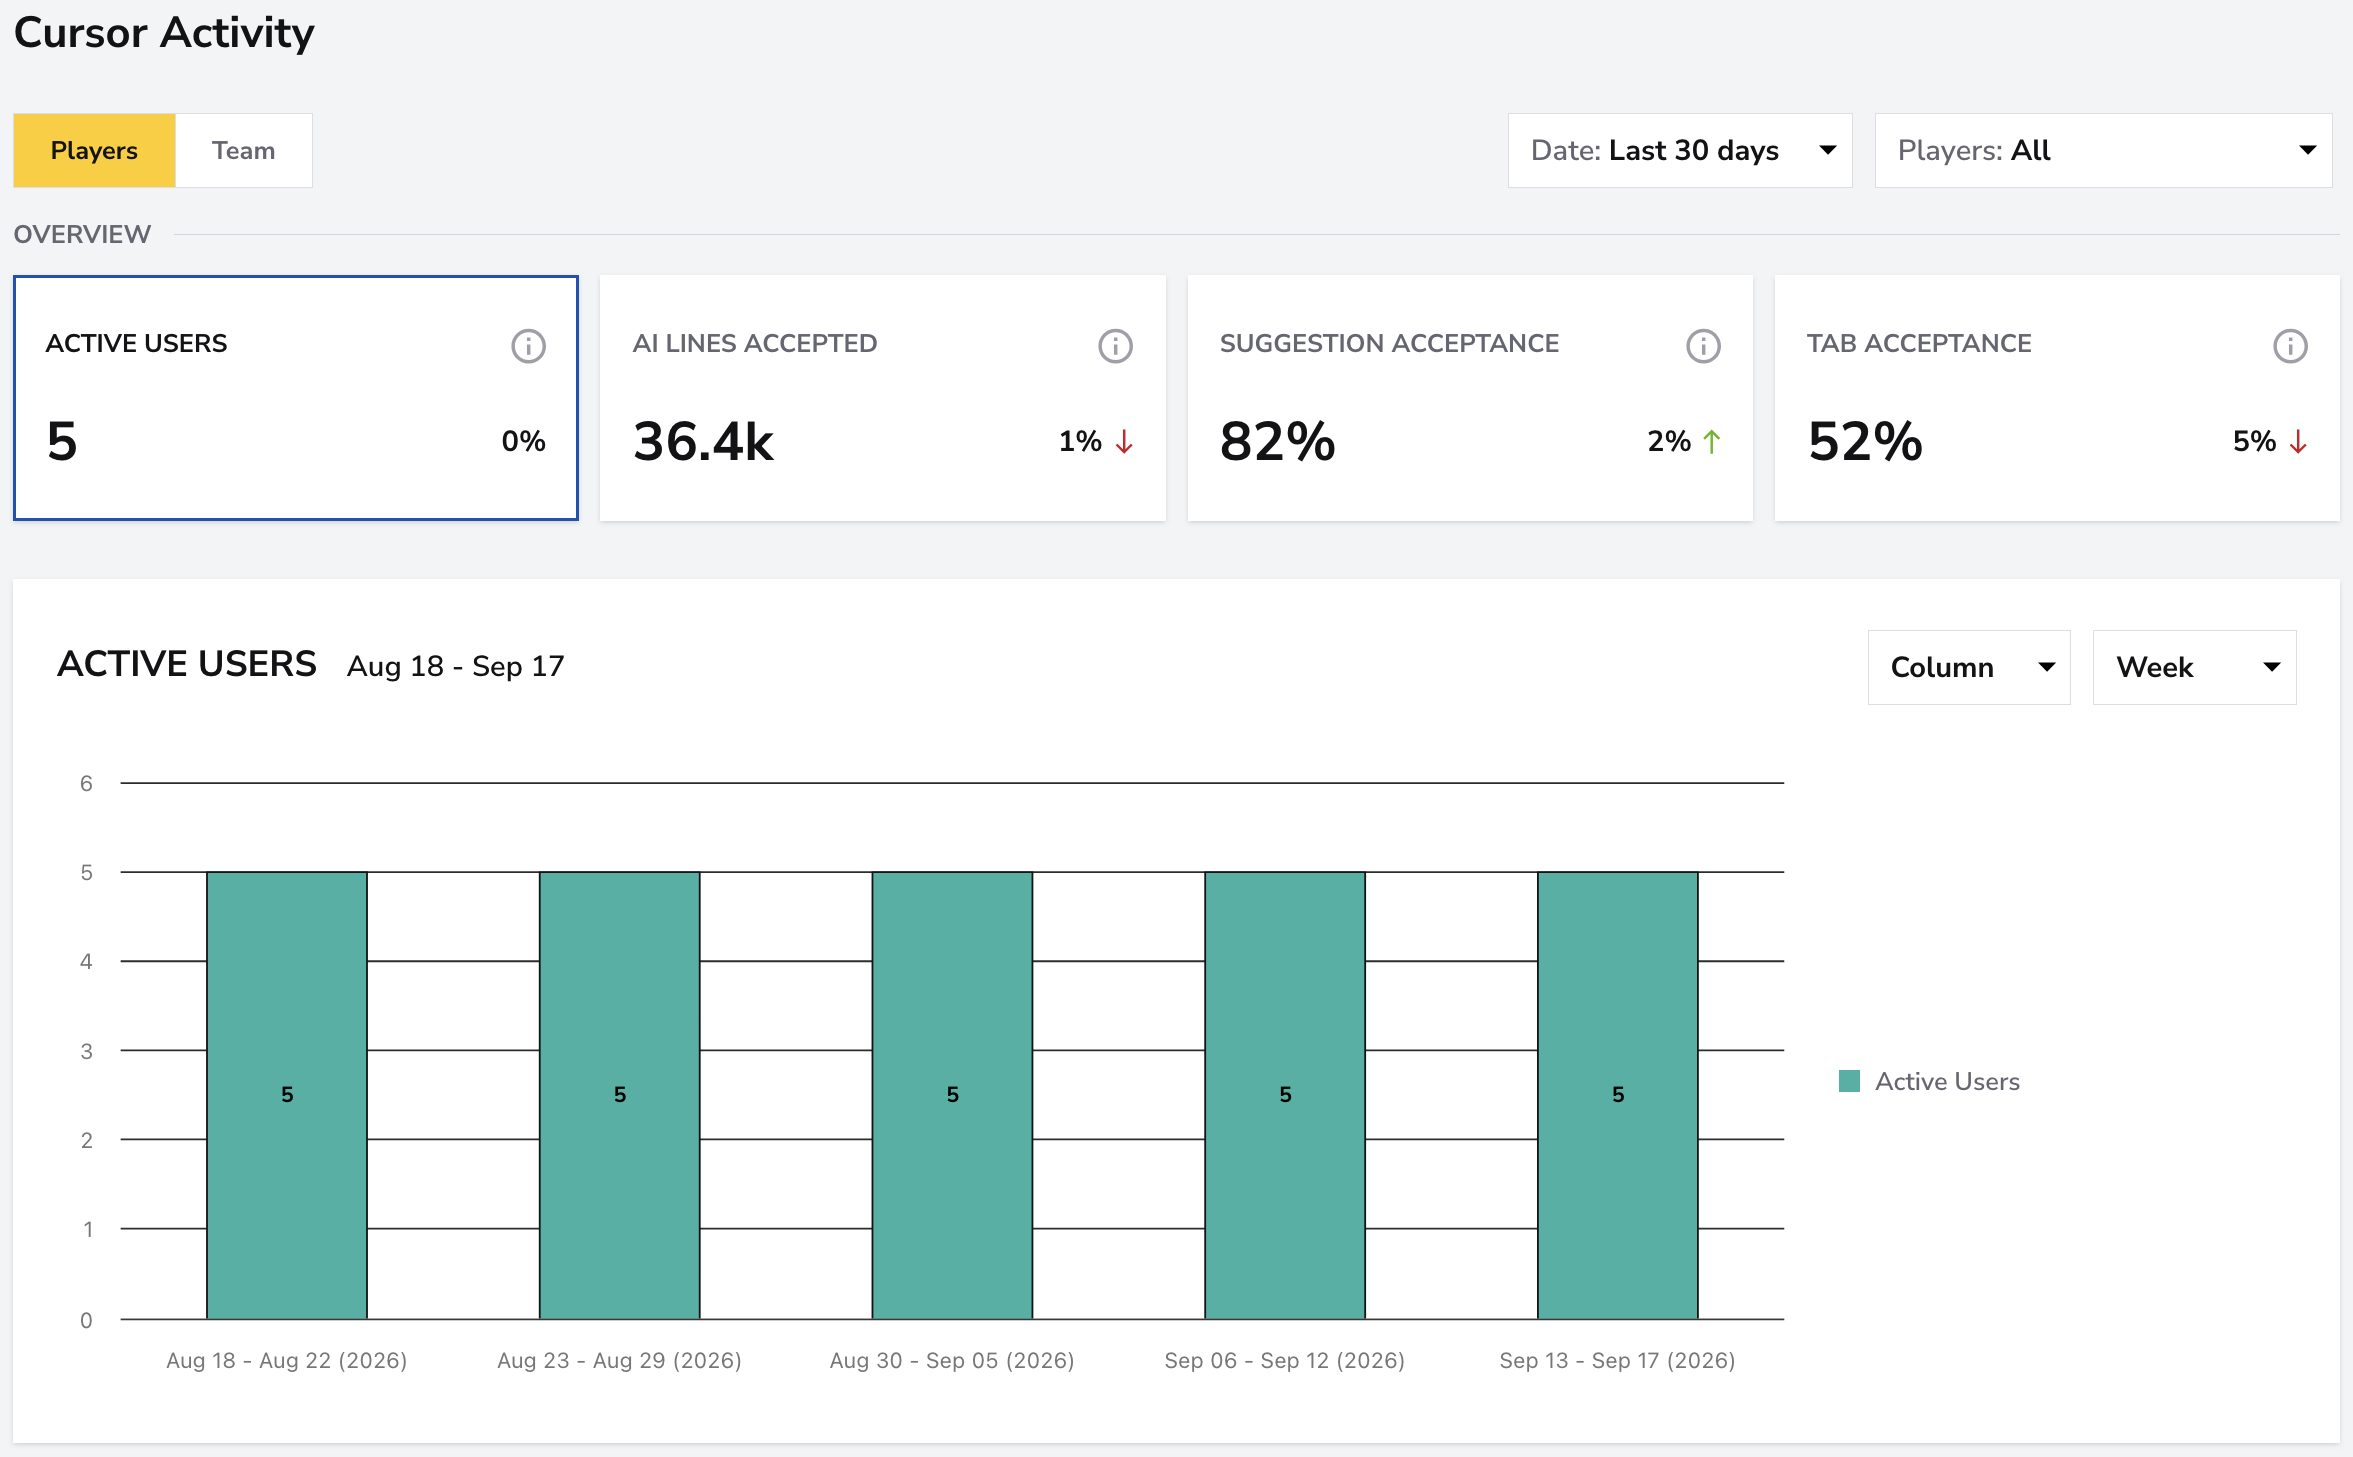
Overview
- Active Users: distinct players with activity marked as active in the selected period.
- AI Lines Accepted: accepted lines added, as recorded by Cursor.
- Suggestion Acceptance: accepted suggestions divided by accepted plus rejected suggestions.
- Tab Acceptance: accepted Tab completions divided by Tab completions shown.
Acceptance rates aggregate the underlying counts for the selected period and players.
Requests
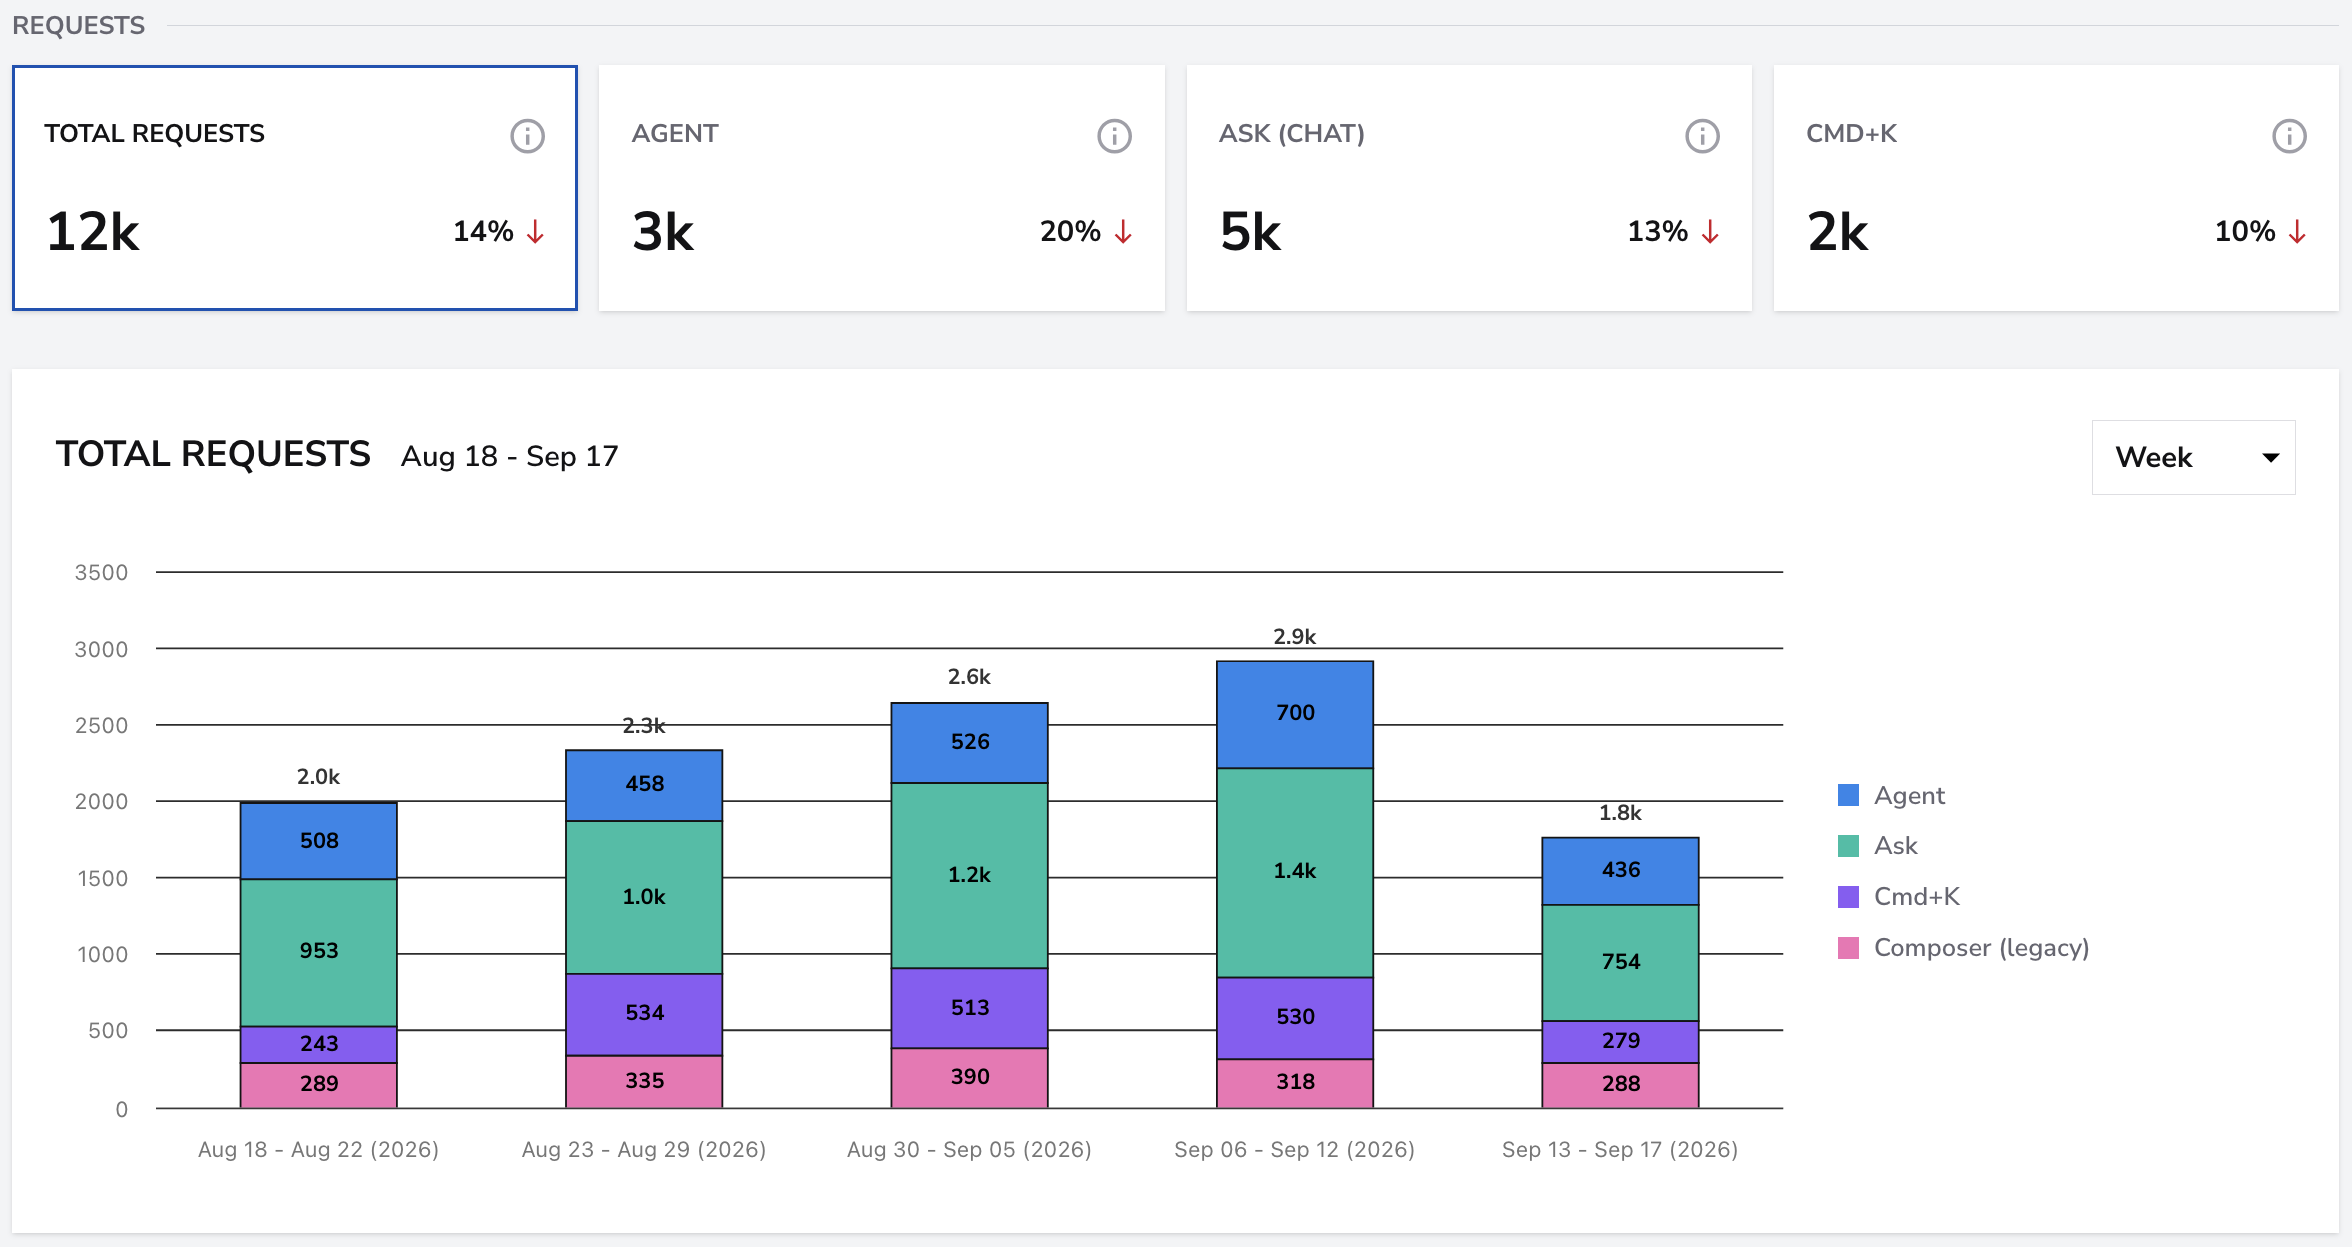
Total Requests includes Agent, Ask, Cmd+K, and Composer requests. The other selectable cards are Agent, Ask (Chat), and Cmd+K. Composer contributes to the total even though it has no separate card.
Suggestions & Tab Completions
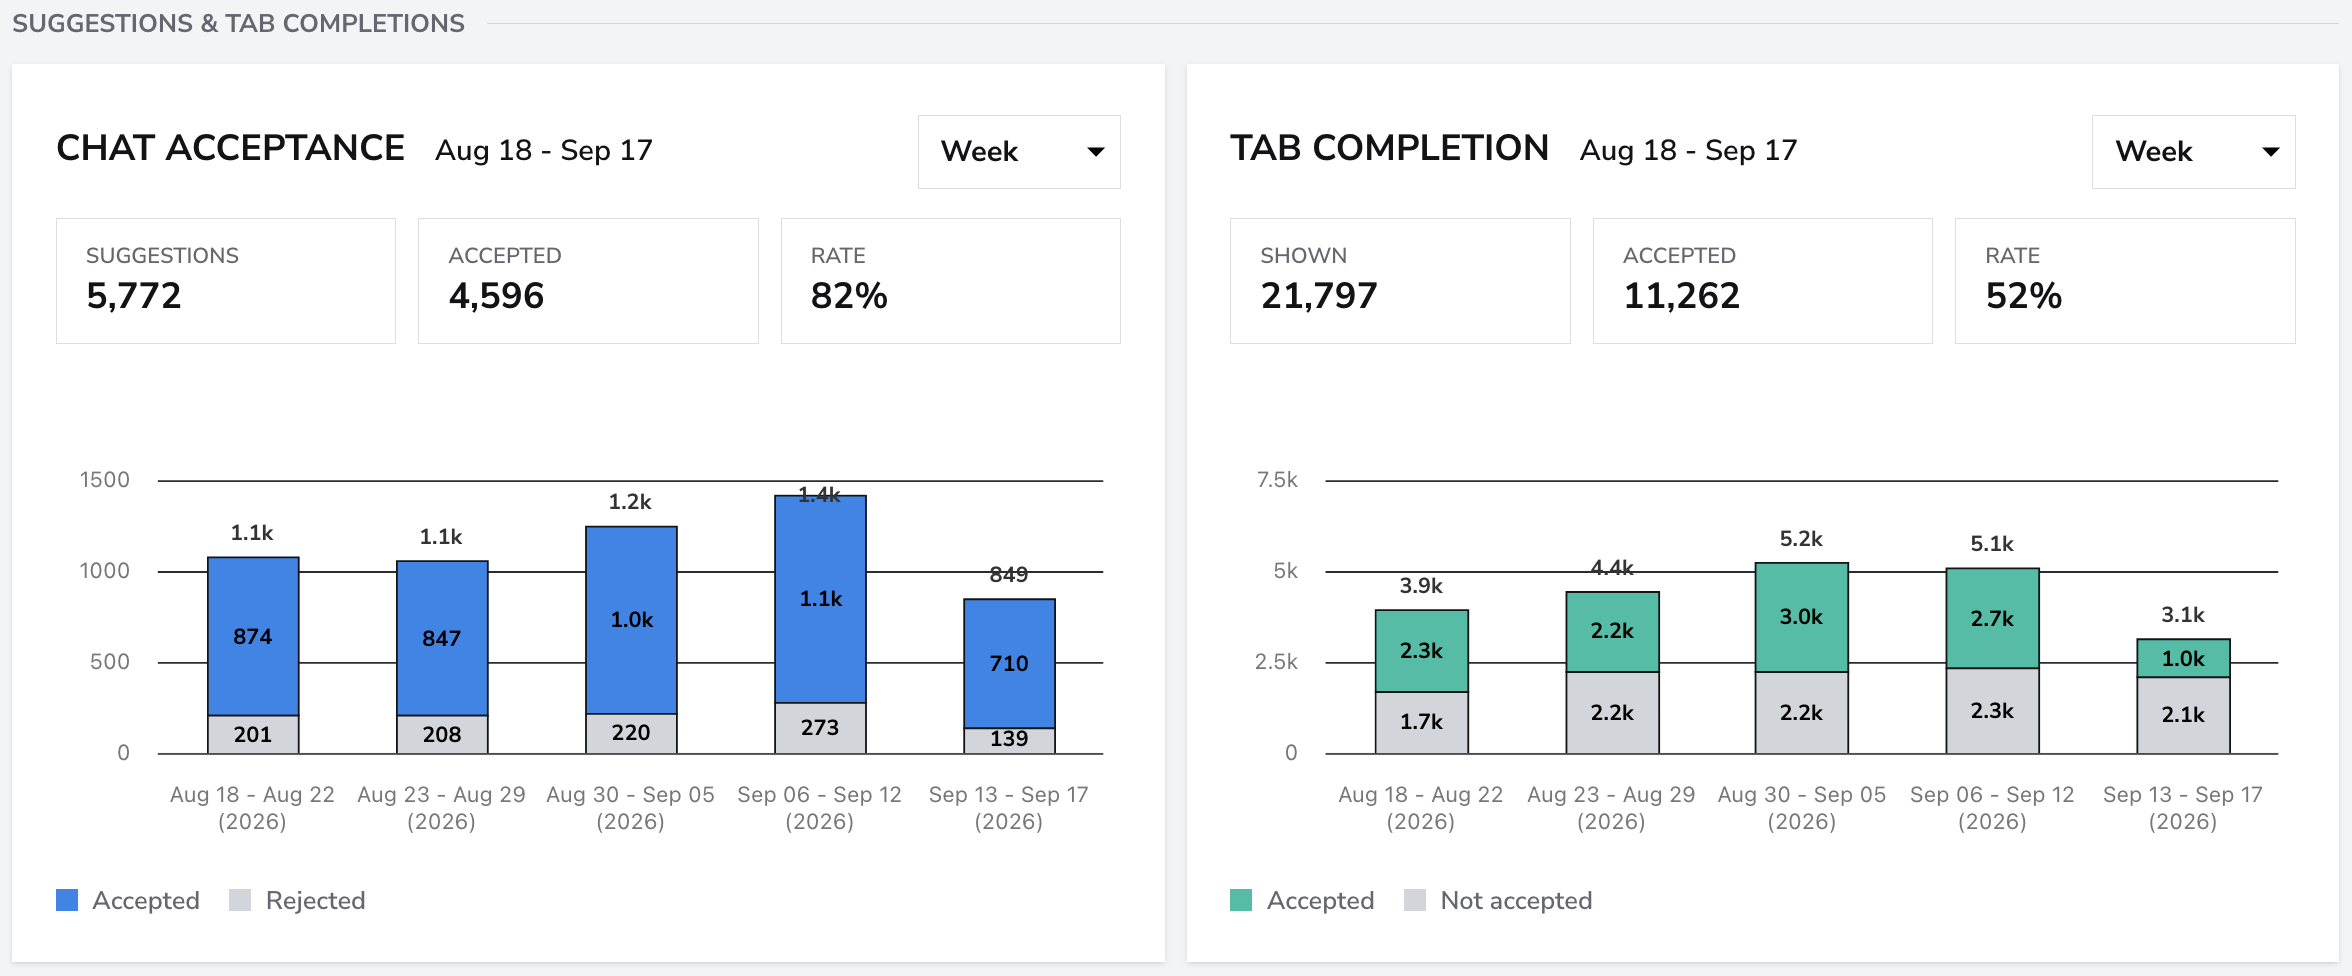
The suggestion chart compares accepted and rejected suggestions. The Tab completion chart compares accepted and not accepted completions. A Tab completion that was shown but not accepted is not necessarily an explicit rejection.
AI Lines of Code
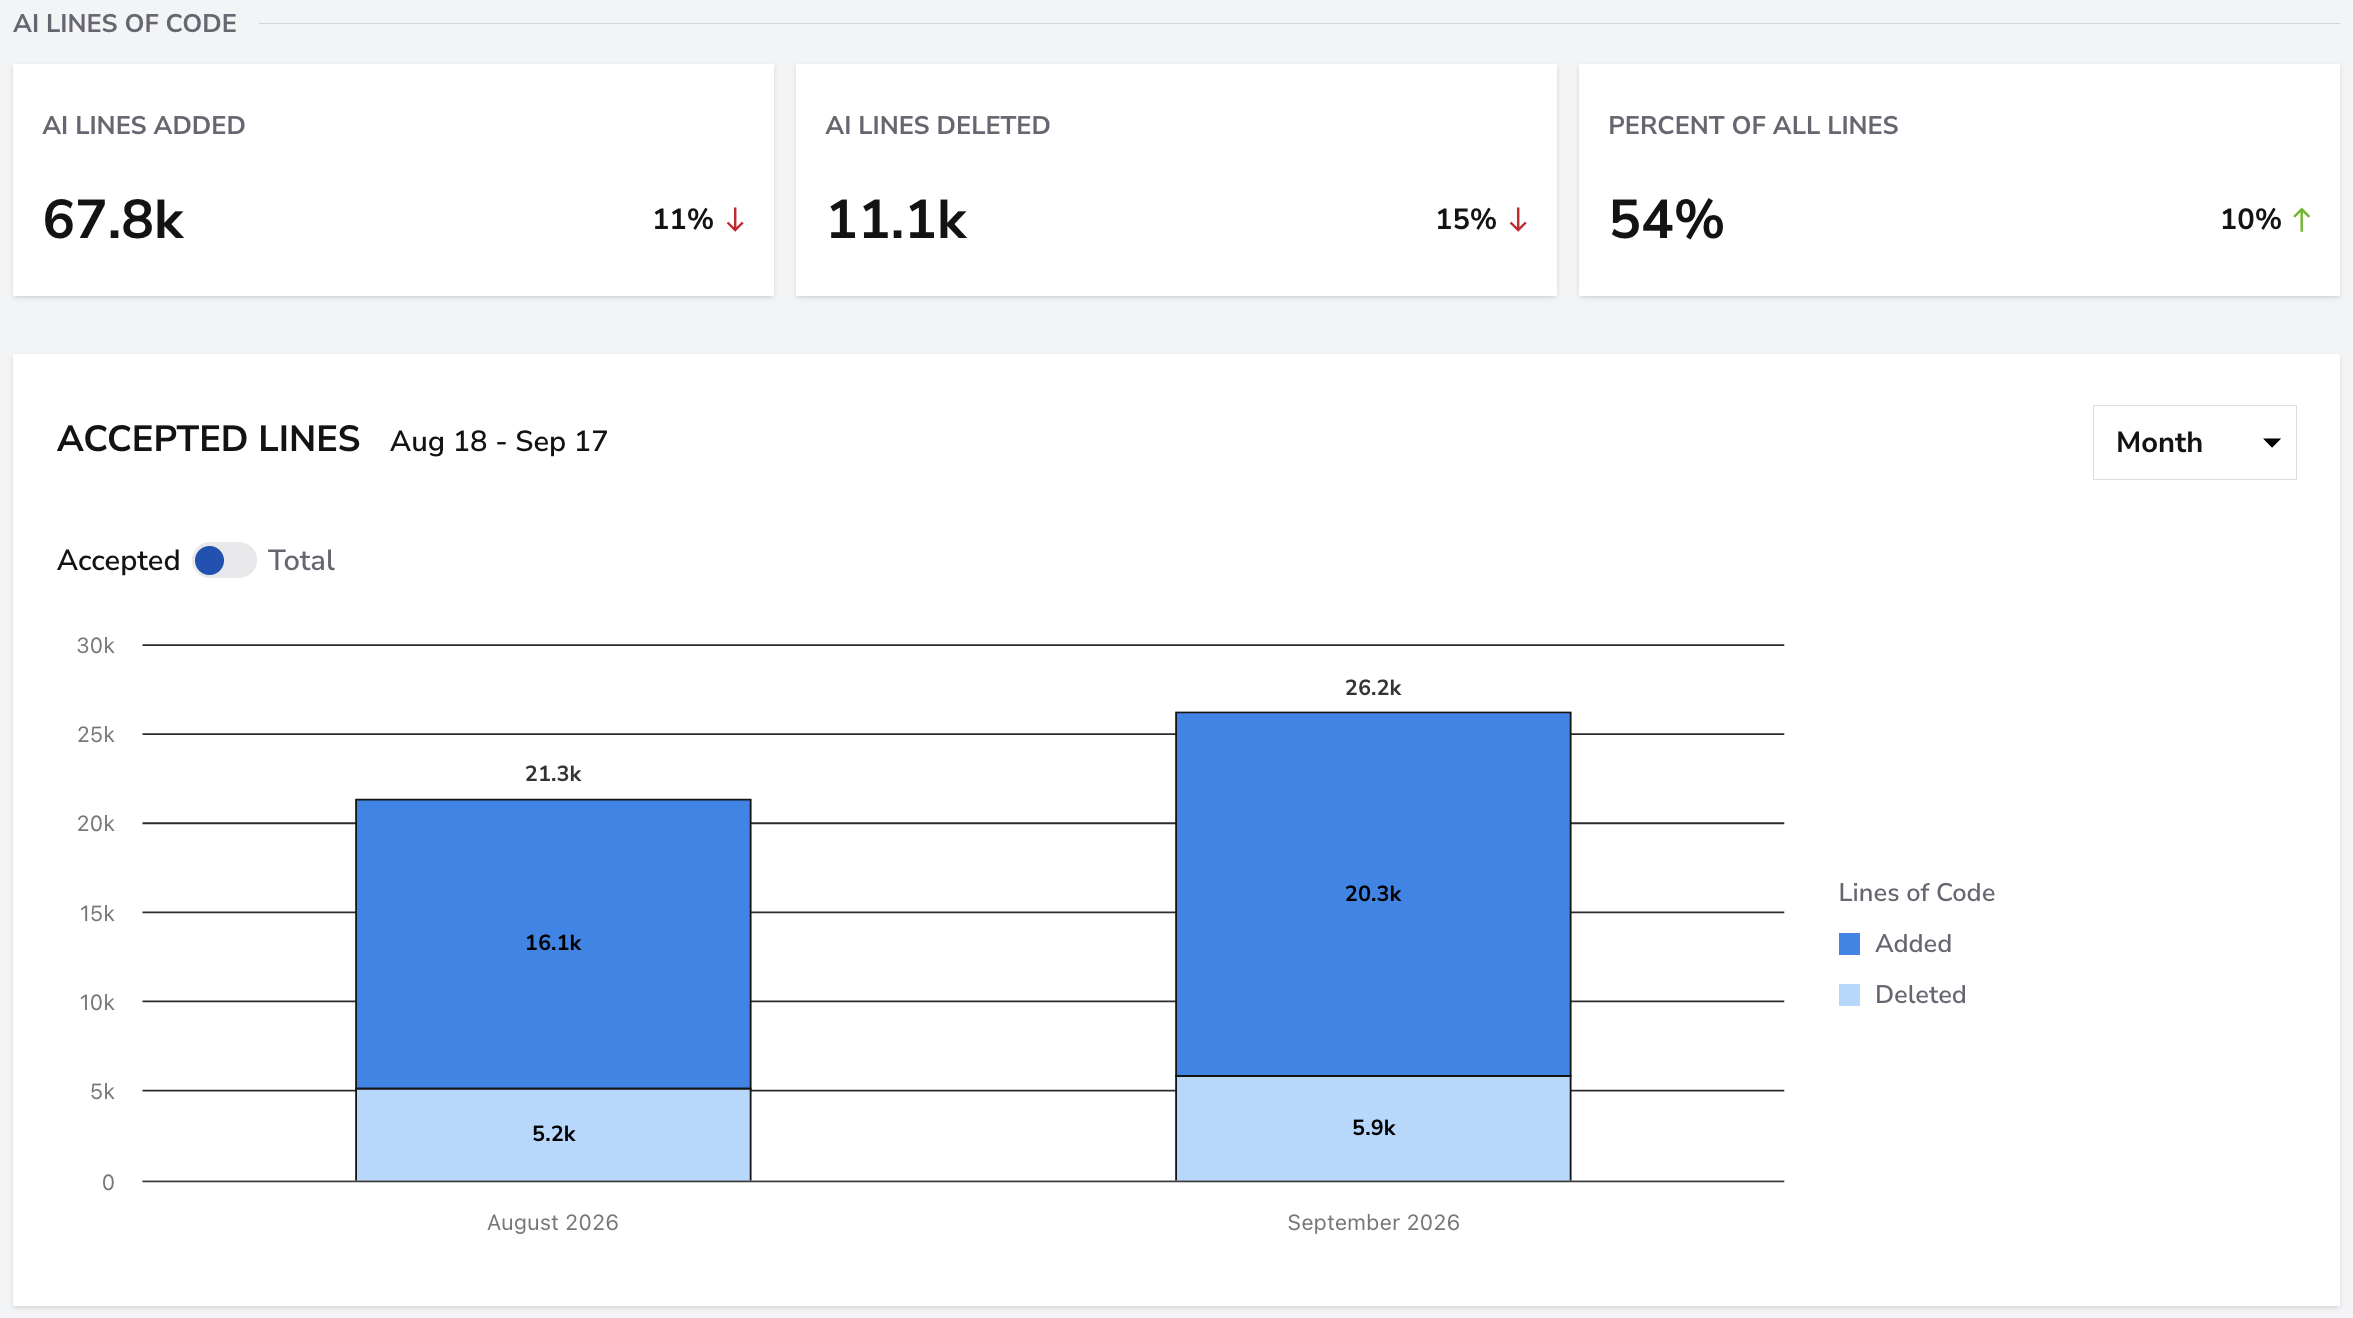
- AI Lines Added: Cursor's recorded total lines added; this differs from the accepted-lines count in Overview.
- AI Lines Deleted: accepted lines deleted.
- Percent of All Lines: accepted lines added plus accepted lines deleted, divided by total lines added plus total lines deleted.
Use the Accepted / Total toggle to compare added and deleted lines for accepted edits or all recorded changes. These are activity measures, not net growth of the codebase.
Agent Edits
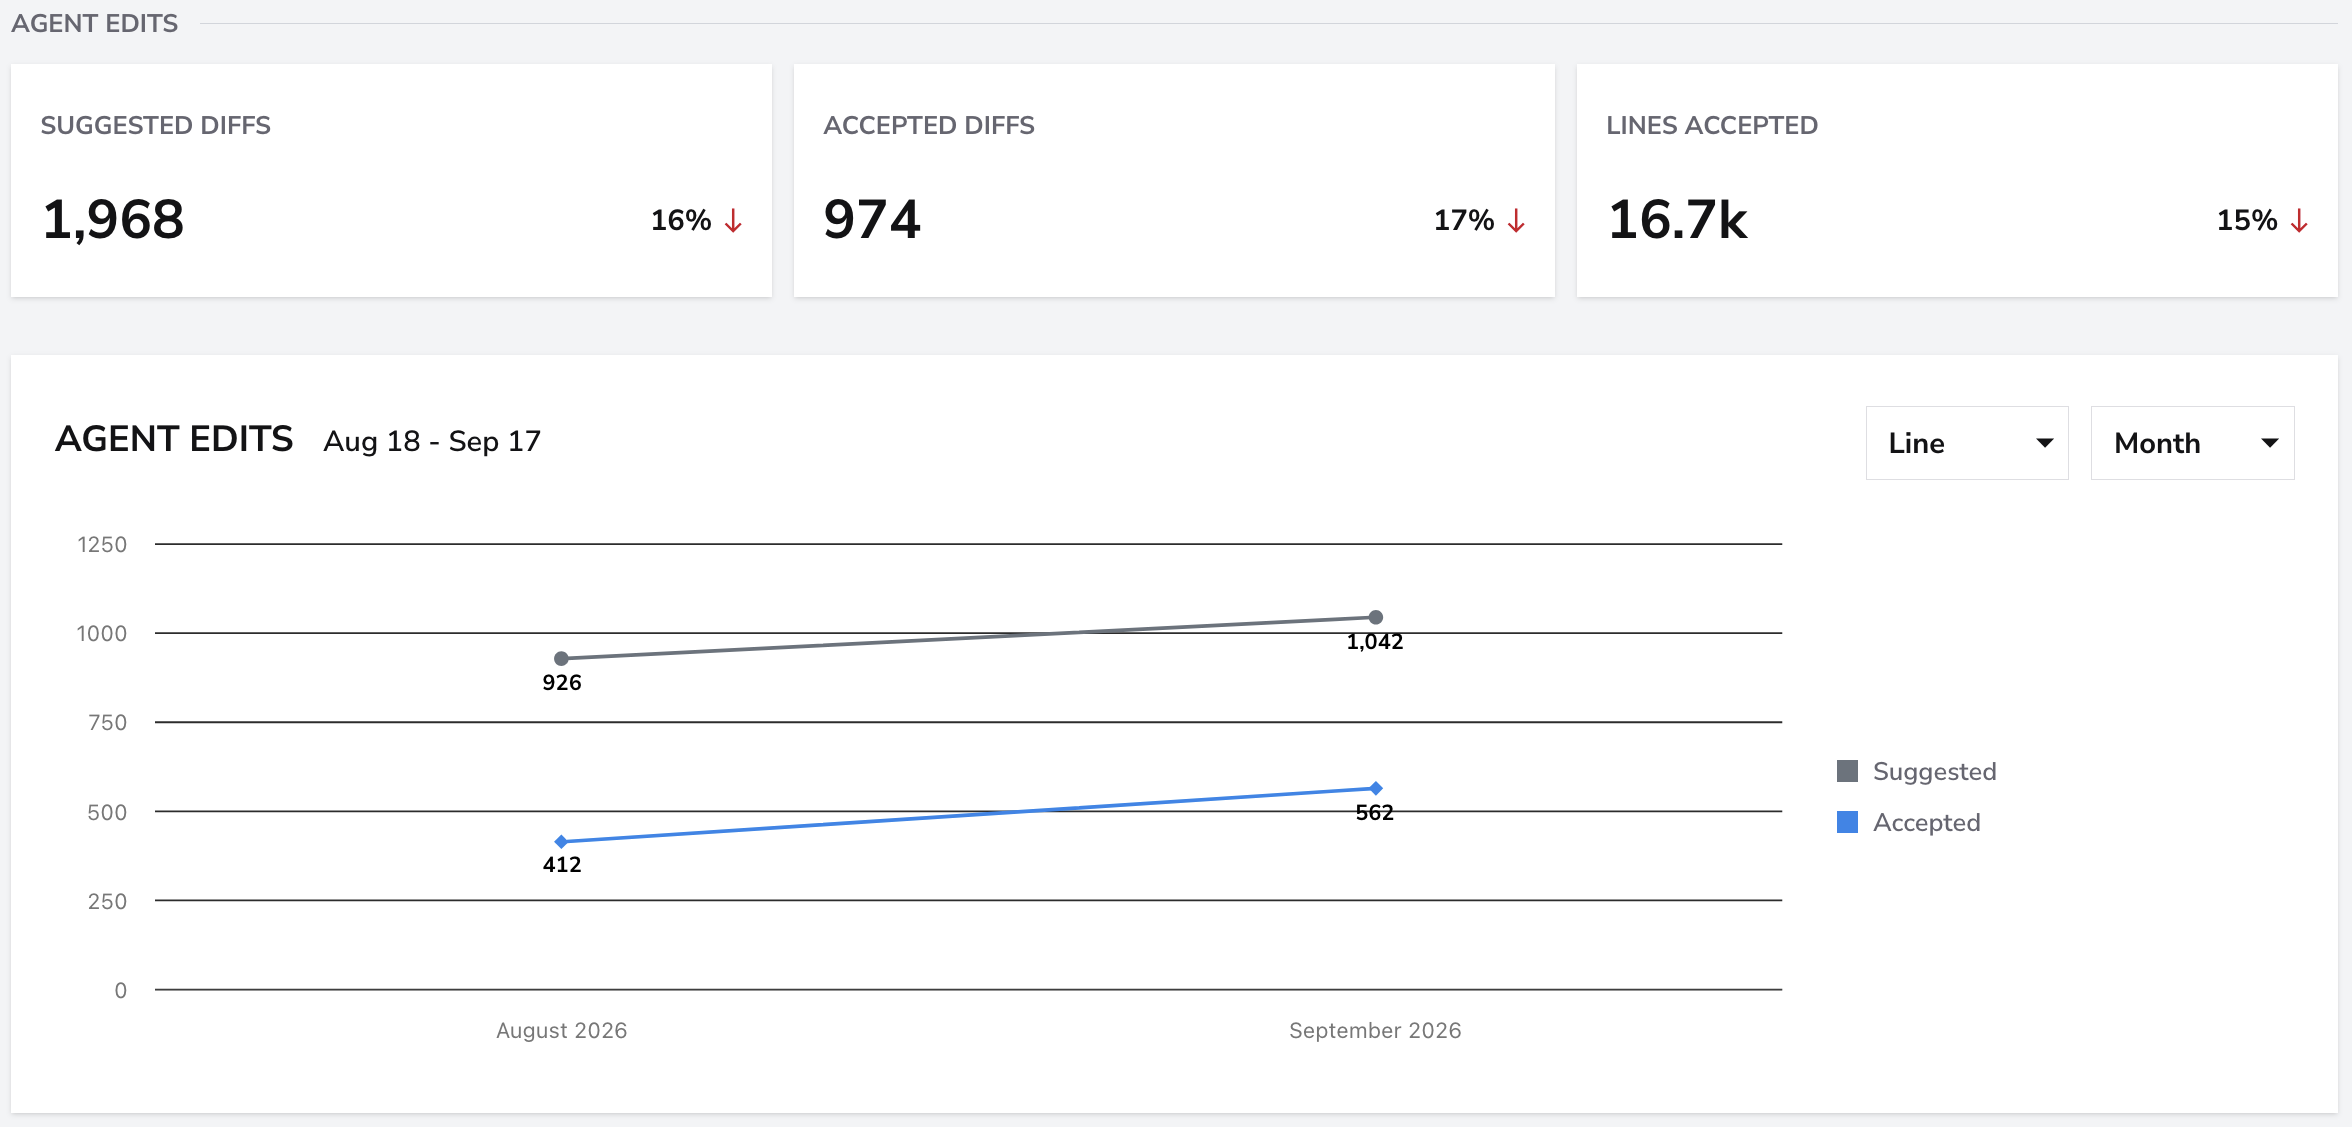
The cards show Suggested Diffs, Accepted Diffs, and Lines Accepted from agent edit records. The chart compares suggested and accepted diffs over time.
Models & Modes
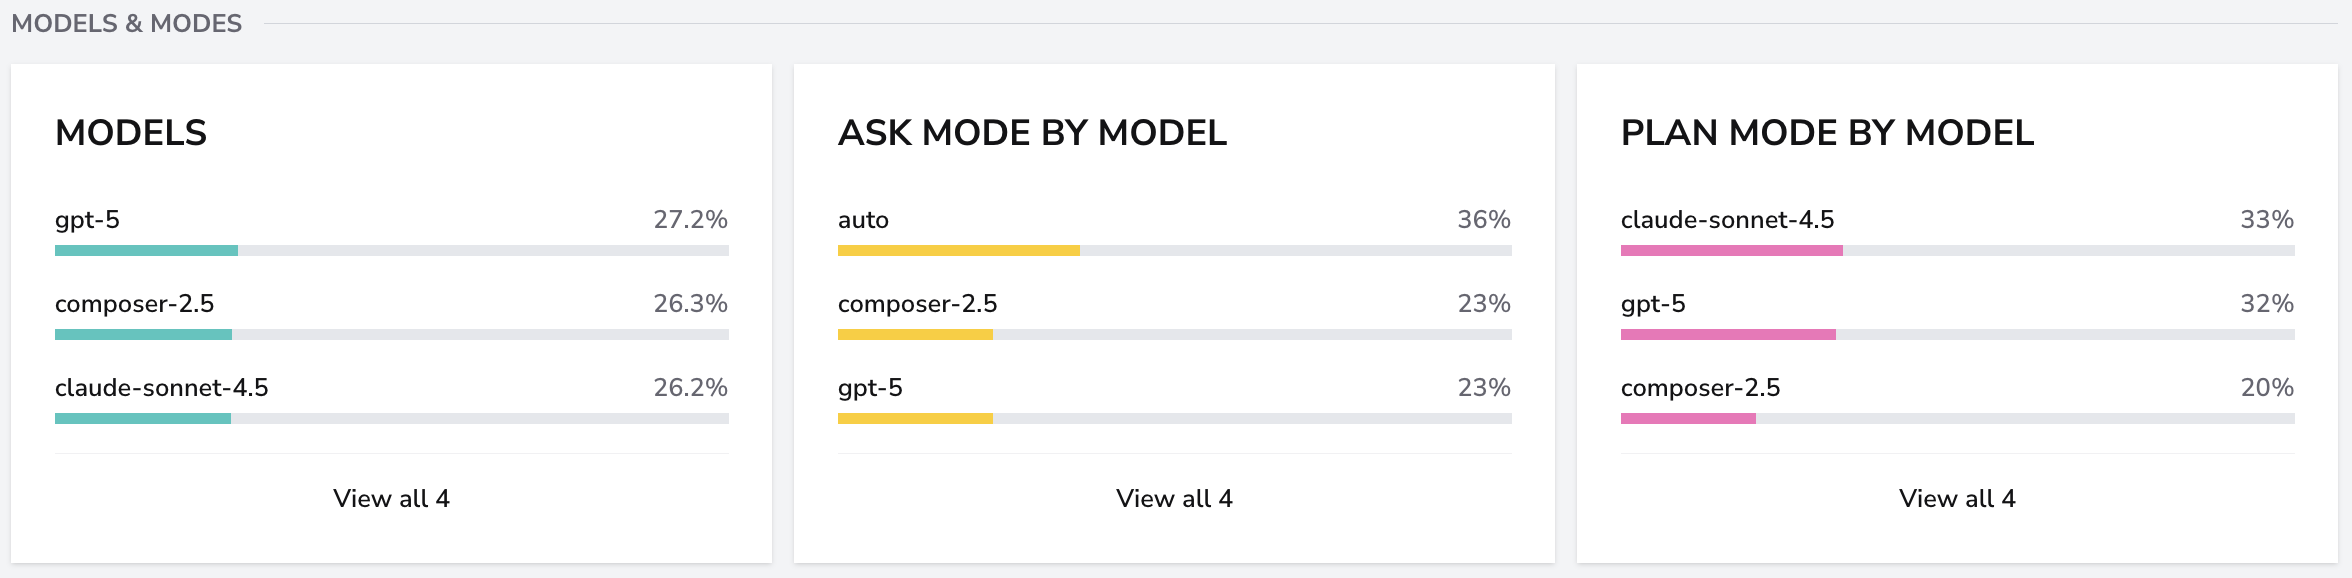
Models shows each model's share of recorded chat messages. The Ask and Plan panels show model shares within their respective modes. These percentages describe message counts, not tokens or cost.
Use View all, where available, to open the full breakdown.
Ecosystem Adoption
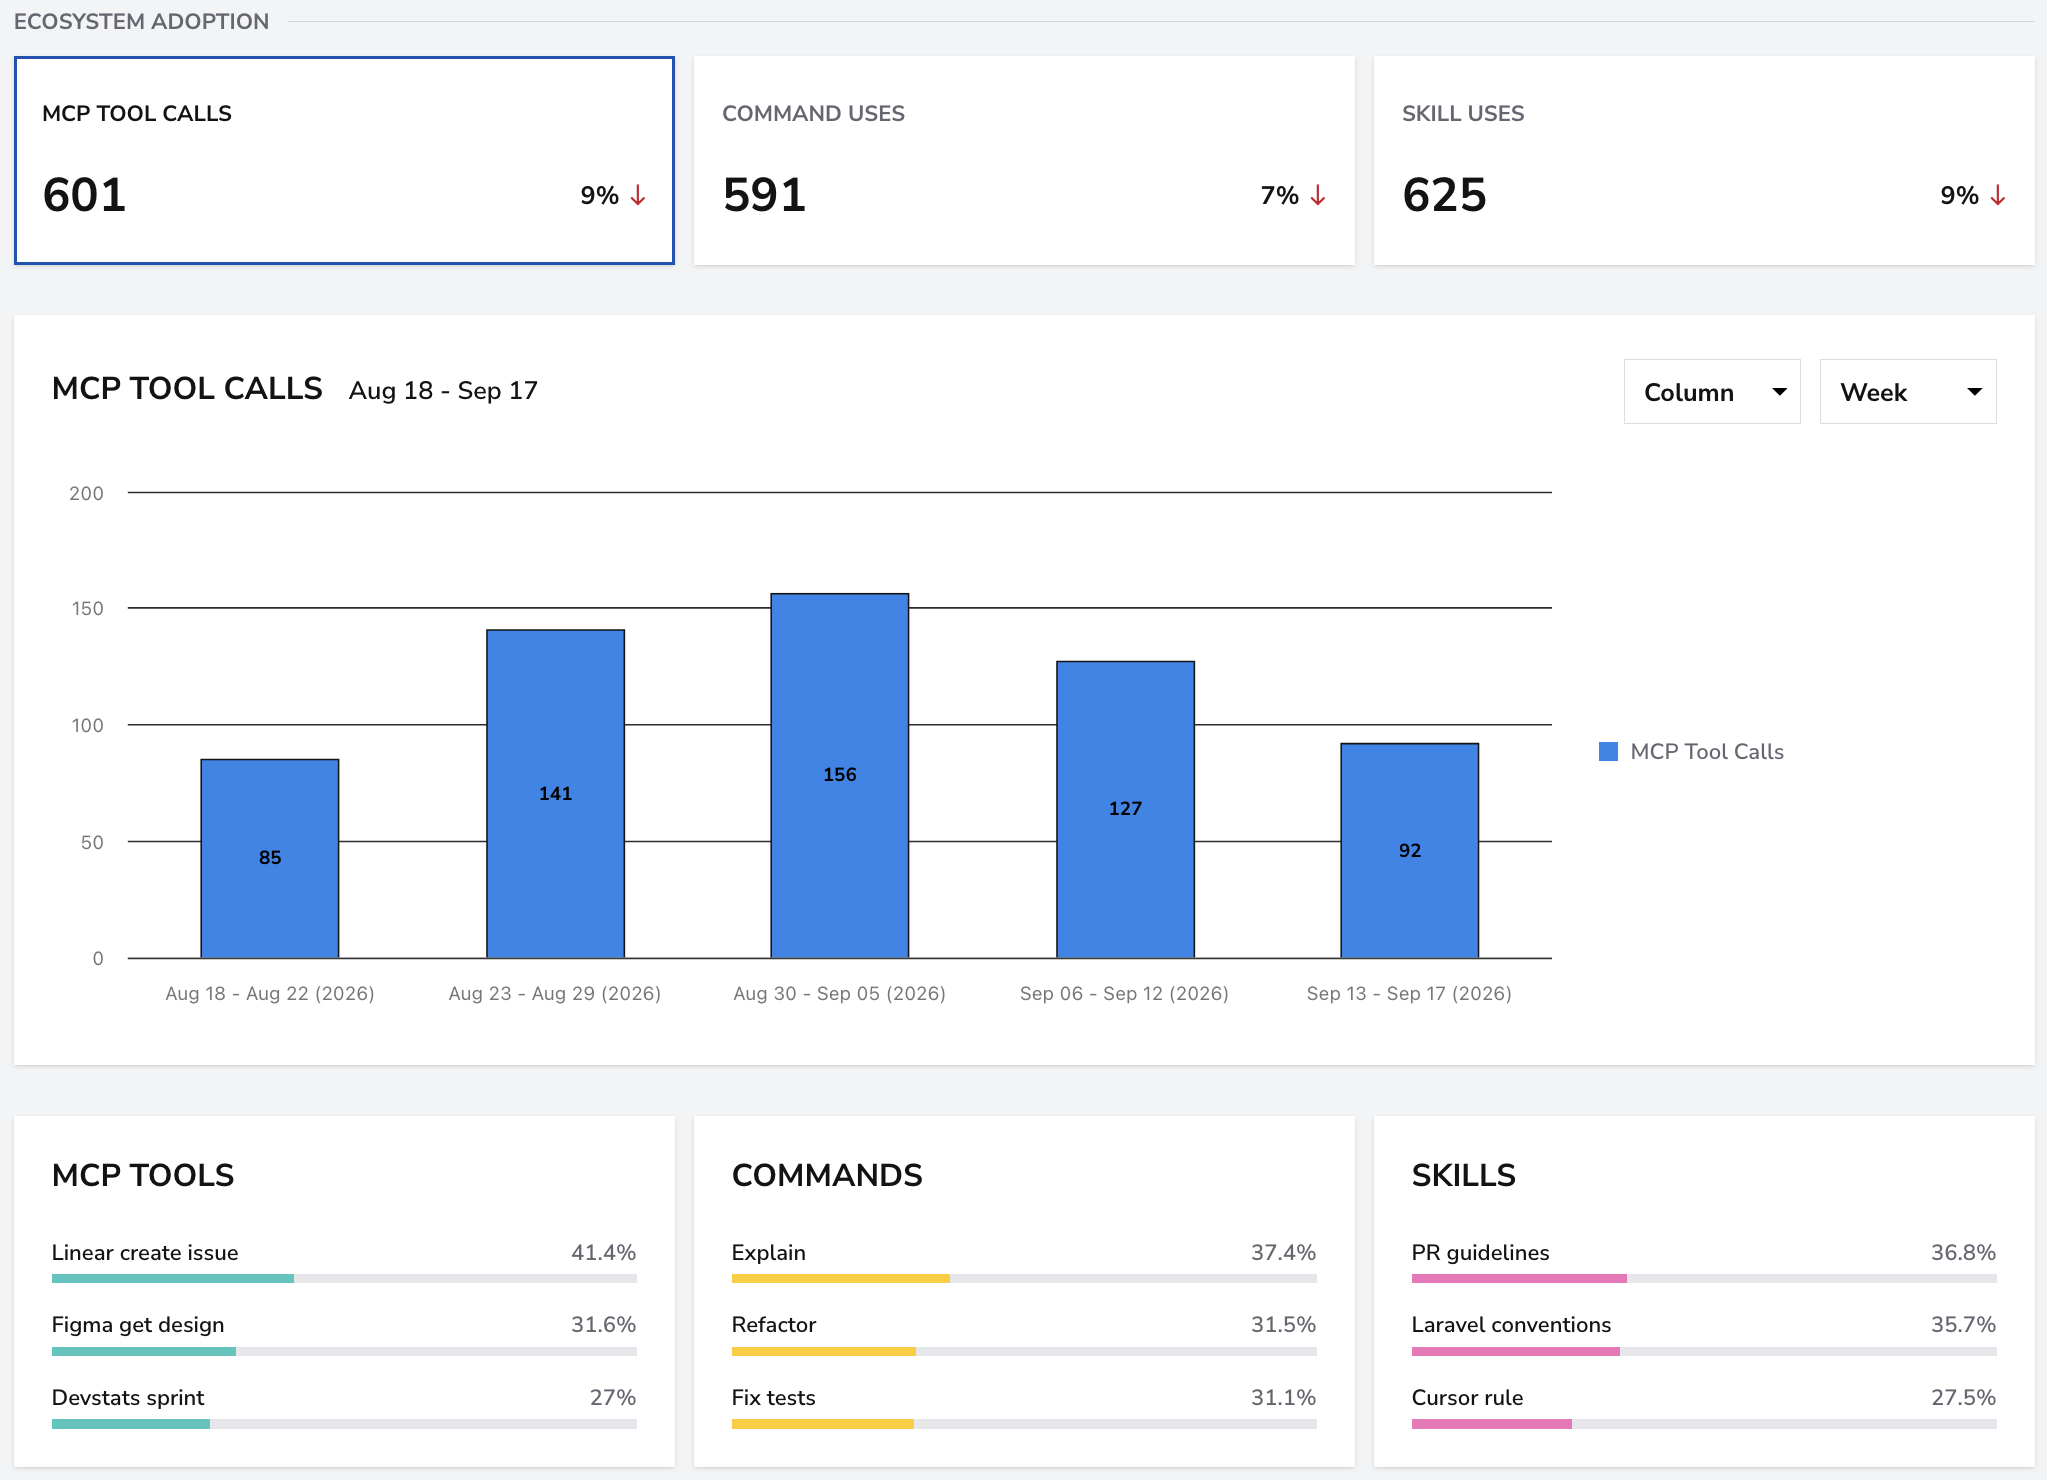
Select MCP Tool Calls, Command Uses, or Skill Uses to inspect the corresponding trend. The breakdown panels list recorded usage by tool, command, and skill.
Languages & Client
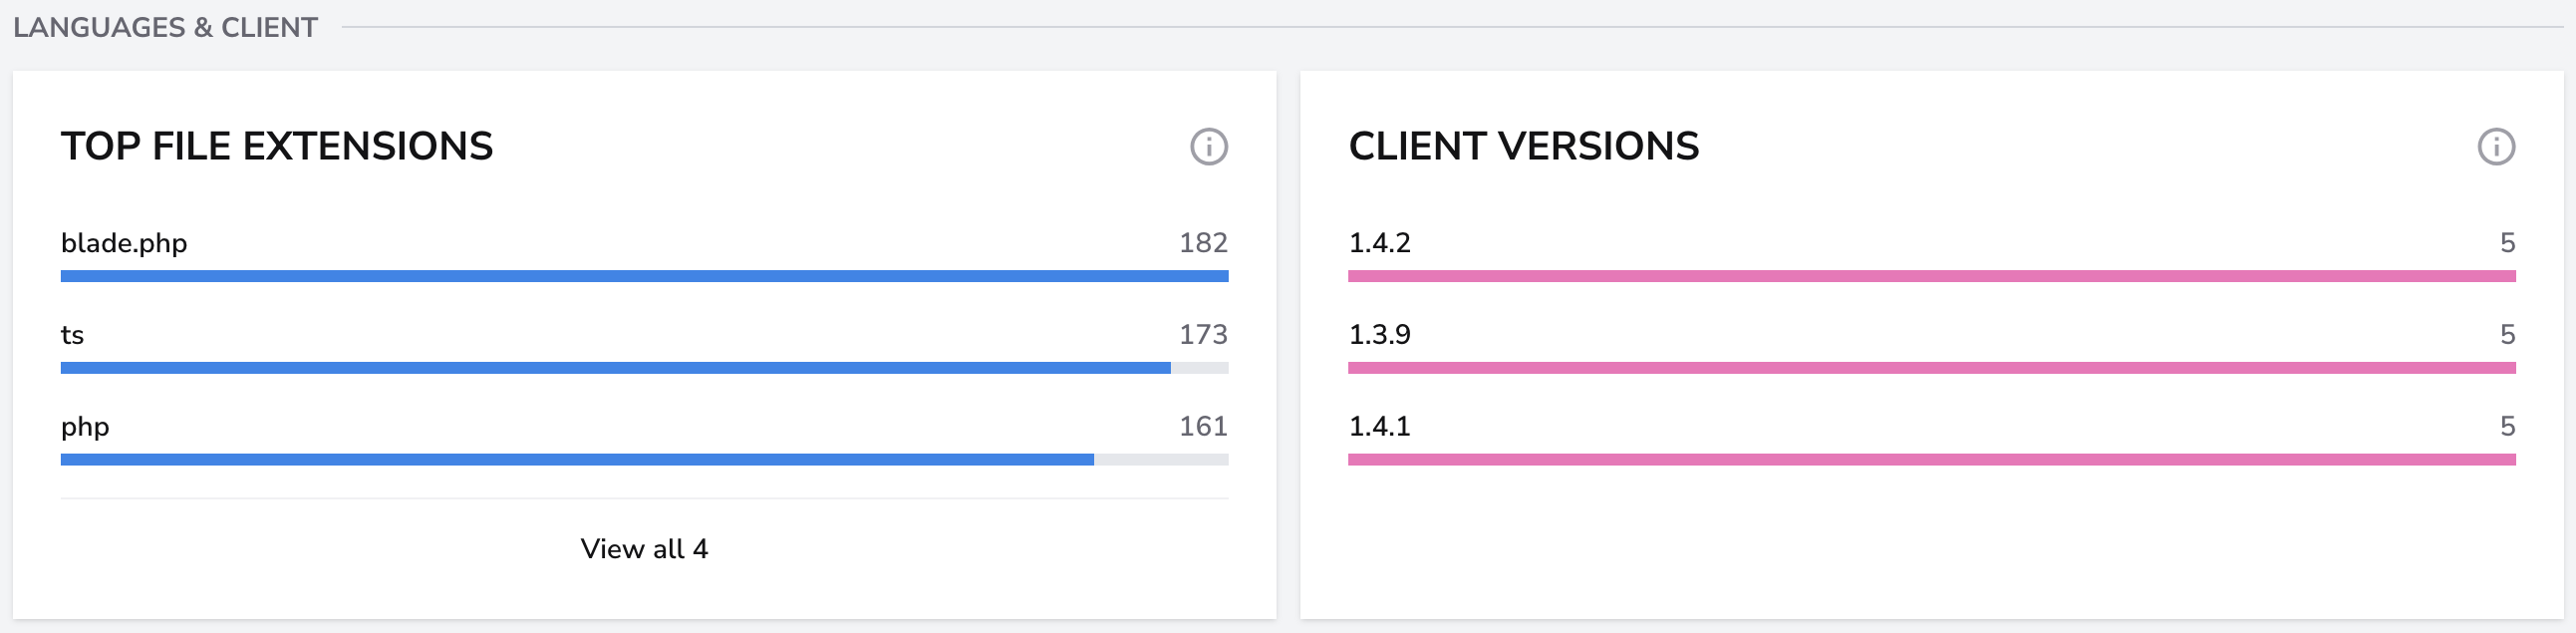
The file-extension panel shows recorded file counts by extension. The client-version panel counts distinct players per version in the selected period. A player who used multiple versions can appear in more than one version's count.
AI Code in Codebase
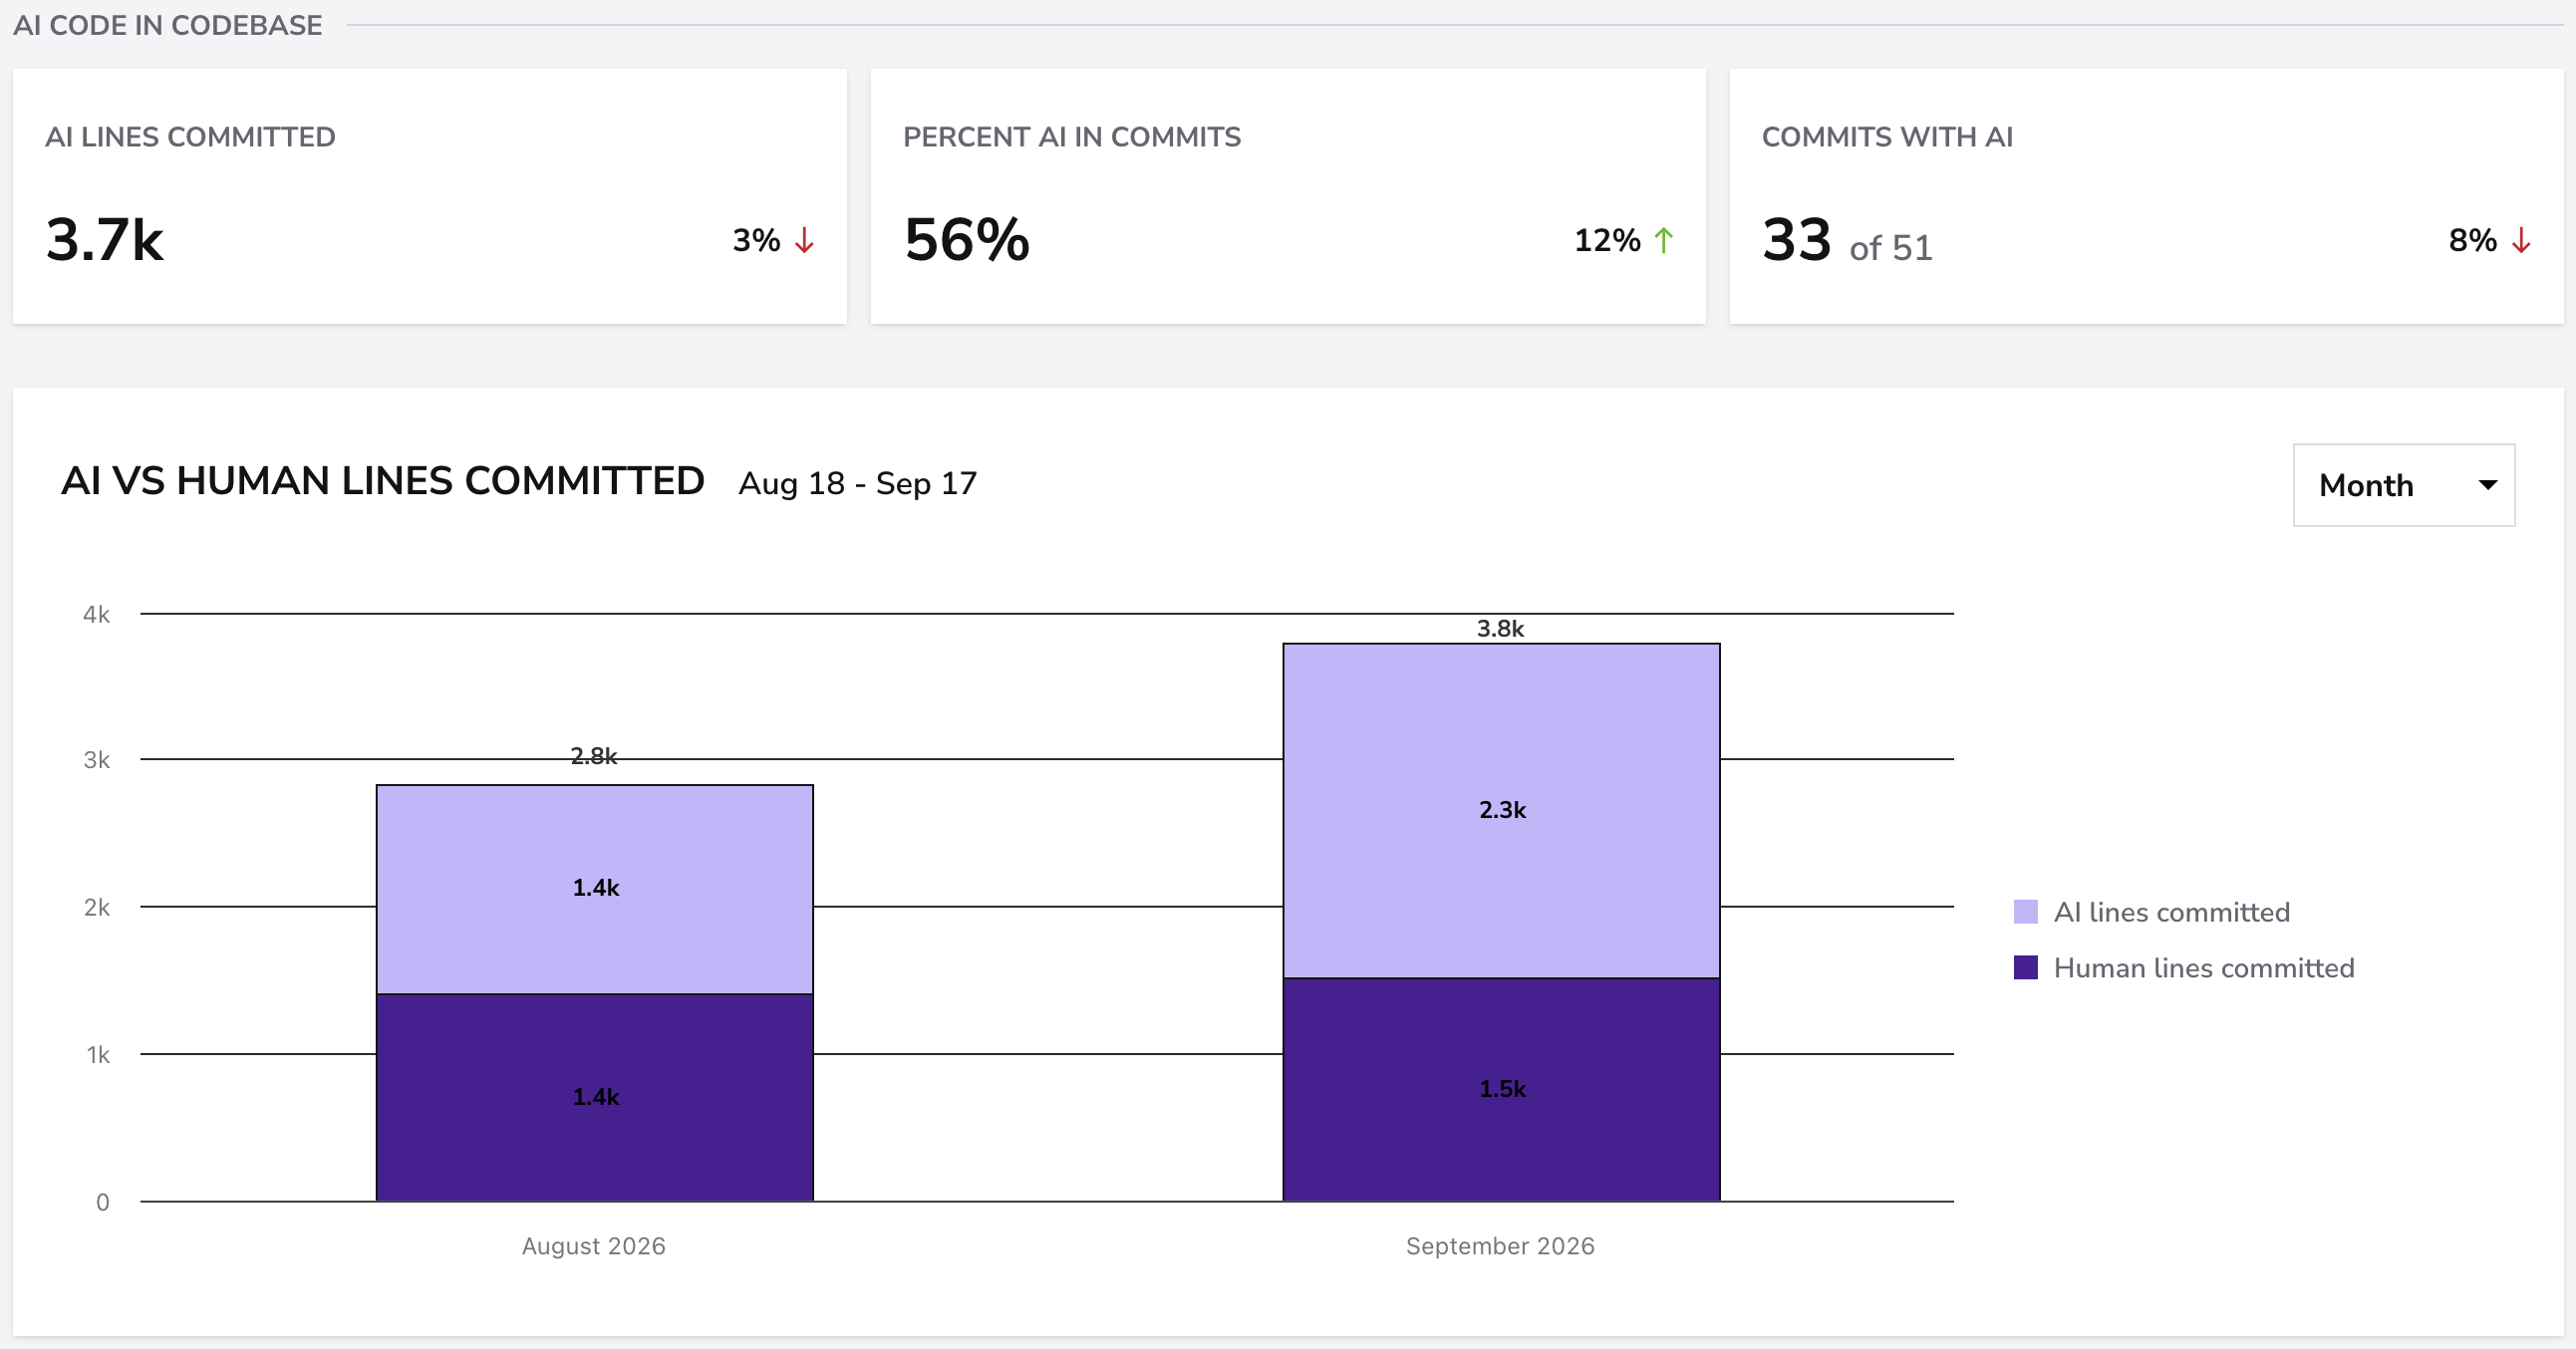
When AI Code Tracking is enabled, this section shows:
- AI Lines Committed: added lines attributed to Tab and Composer in tracked commits.
- Percent AI in Commits: those AI-added lines divided by all added lines in tracked commits.
- Commits with AI: distinct tracked commits with AI-added lines, shown alongside the total tracked commit count.
The chart compares AI-added lines (Tab and Composer combined) with human-added lines in tracked commits. Accepted editor suggestions and committed code are different stages; their totals need not match.
Players table
The table includes Players, Active Days, Requests, Suggestion Accept, Tab Accept, AI LOC, Top Model, and MCP Uses. AI LOC is accepted lines added. AI LOC Committed appears when AI Code Tracking is enabled.
Use search and sortable column headings to inspect individual activity. User names are matched to players by email when needed; unmatched users can appear as Unmapped: email.
Highlighted API rows identify non-human actors. Their activity remains included in totals.
Team tab
Overview and surfaces
- Active Users: distinct active players in the selected period.
- Weekly, Avg: average distinct active players across weeks with active records.
- Daily, Avg: average distinct active players across days with active records.
Days and weeks without active records are not included in these averages.
Active Users by Surface shows IDE usage as an average daily user count. CLI, Cloud Agents, and Bugbot are percentages of recorded active-user counts in each chart interval. The series use different units and should not be added together.
Adoption: Licensed vs Active
This panel compares licensed seats from the latest organization record in the selected period with distinct active players over that period. Inactive is the remaining seat count, with a minimum of zero.
Conversation Insights
When enabled, this section shows Intent, Complexity, Work Categories, and Guidance Level. Each label's percentage is averaged across the available records in the selected period. Use View all, where available, for the complete breakdown.
Bugbot
- PRs Reviewed: distinct repository and pull request combinations reviewed in the selected period.
- Issues Found: recorded issues found by Bugbot.
- Issues Resolved: recorded issues resolved.
The severity chart separates High, Medium, and Low findings. These are Bugbot review findings, not project-management issues.
How to interpret the report
Use Cursor Activity alongside delivery and quality metrics. Acceptance does not prove that a suggestion is correct, and more requests or generated lines do not by themselves show faster or better delivery.
Keep editor activity, tracked commits, and team adoption separate when comparing results. They use different data sources, populations, and denominators.