What is the Engineering Investment Feature?
The Engineering Investment feature provides a clear and structured view of how engineering resources are distributed across key categories —new features, improvements, maintenance, and productivity tasks. By visualizing this allocation, teams can better understand where their effort is going, ensure a healthy balance between innovation and sustainability, and make data-driven decisions to optimize engineering impact.
Verify if all tasks have been configured by clicking the gear icon at the top right. Follow this how-to guide to quickly configure the engineering investment report—it only takes two minutes!
Metrics
The Engineering Investment feature offers key metrics to help teams monitor and analyze the distribution of their engineering efforts. These metrics track the allocation of resources across various categories, including:
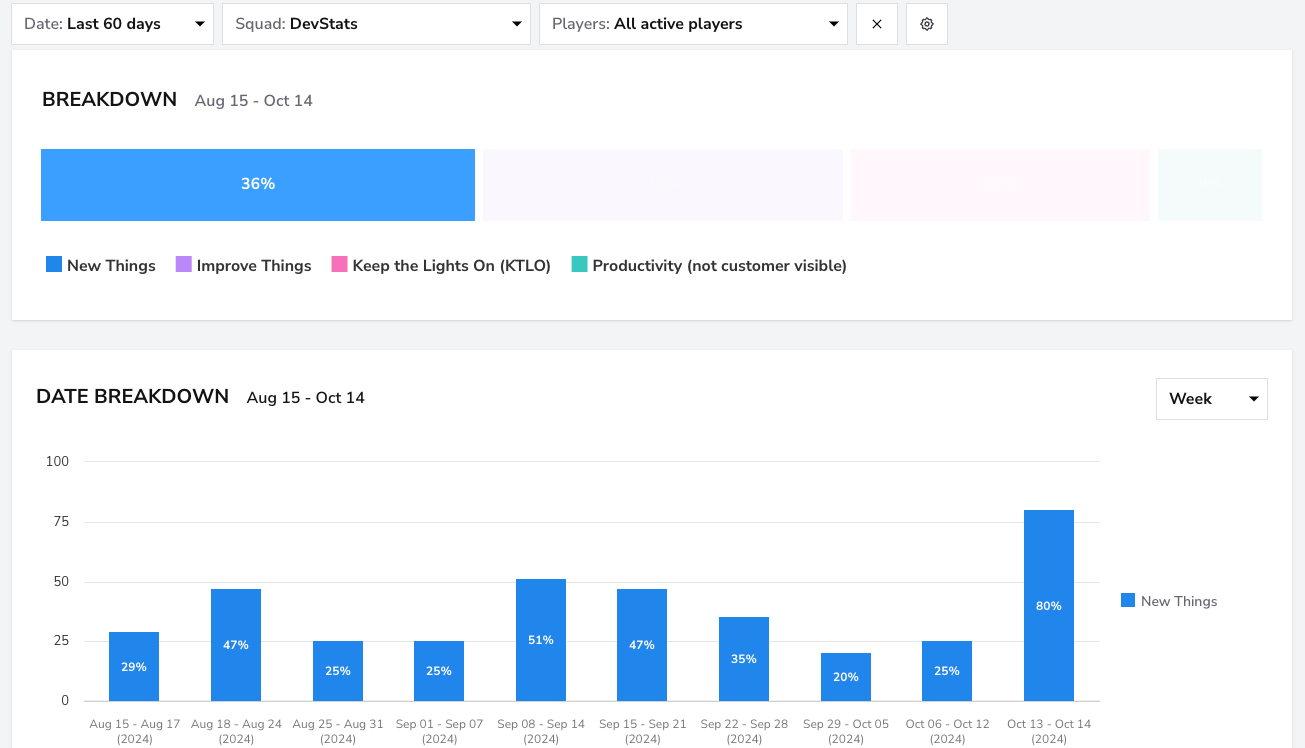
New Things (Build New Stuff)
- What: Displays the total number of tasks related to developing new features and functionalities for customer acquisition and market expansion.
- Why it matters: This metric helps track your team’s focus on innovation and product growth, giving insight into how much effort is directed toward building new features to drive business value.
- How to use it: Compare this metric across different time periods to see whether your team’s focus on innovation is increasing or decreasing. Use this insight to align engineering priorities with business objectives such as new product launches, competitive differentiation, or market expansion.
- Recommended issue types: StoryTask
- User interface:
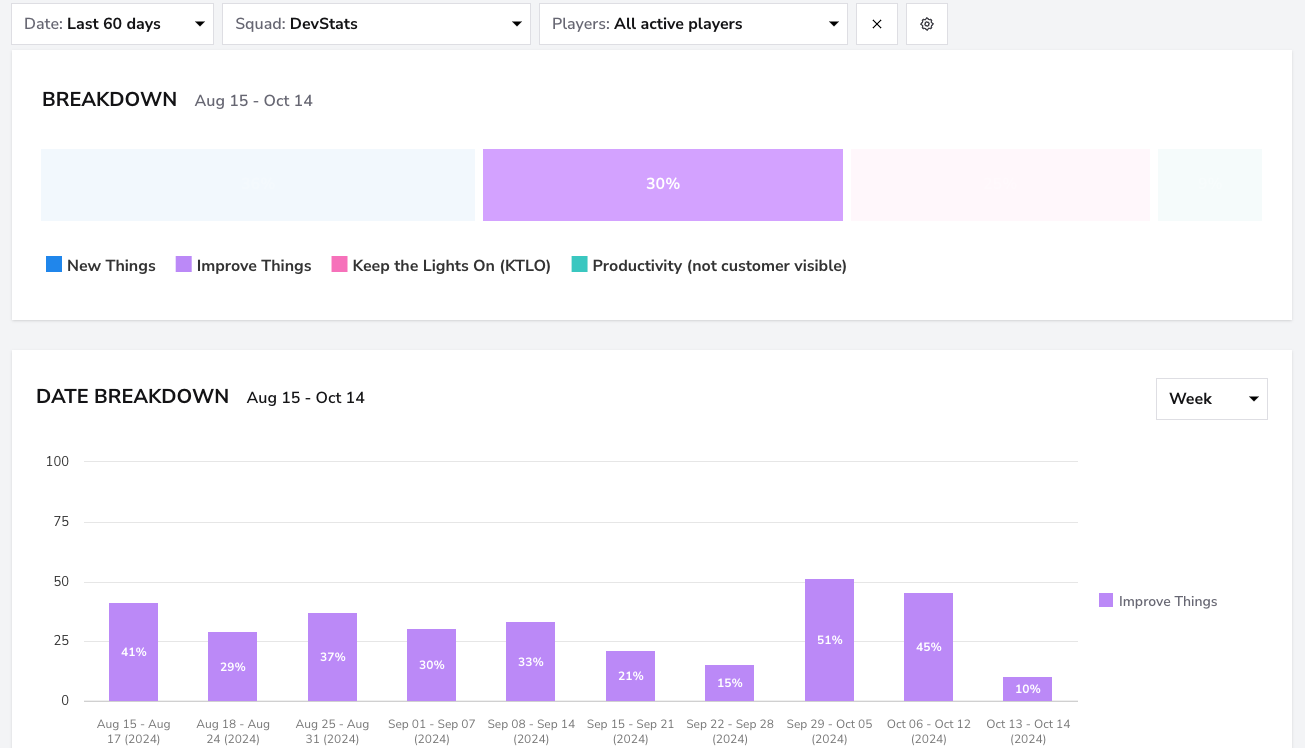
Improve Things (Improve Existing Stuff)
- What: Displays the total number of tasks aimed at improving and enhancing existing features to boost customer satisfaction and retention.
- Why it matters: This metric helps measure the team's dedication to refining current features, ensuring continuous improvement and customer engagement.
- How to use it: Track the number of improvements made over time and compare with customer feedback or support tickets to ensure that the enhancements address real user needs.
- Recommended issue types: EnhancementRefactorImprovement
- User interface:
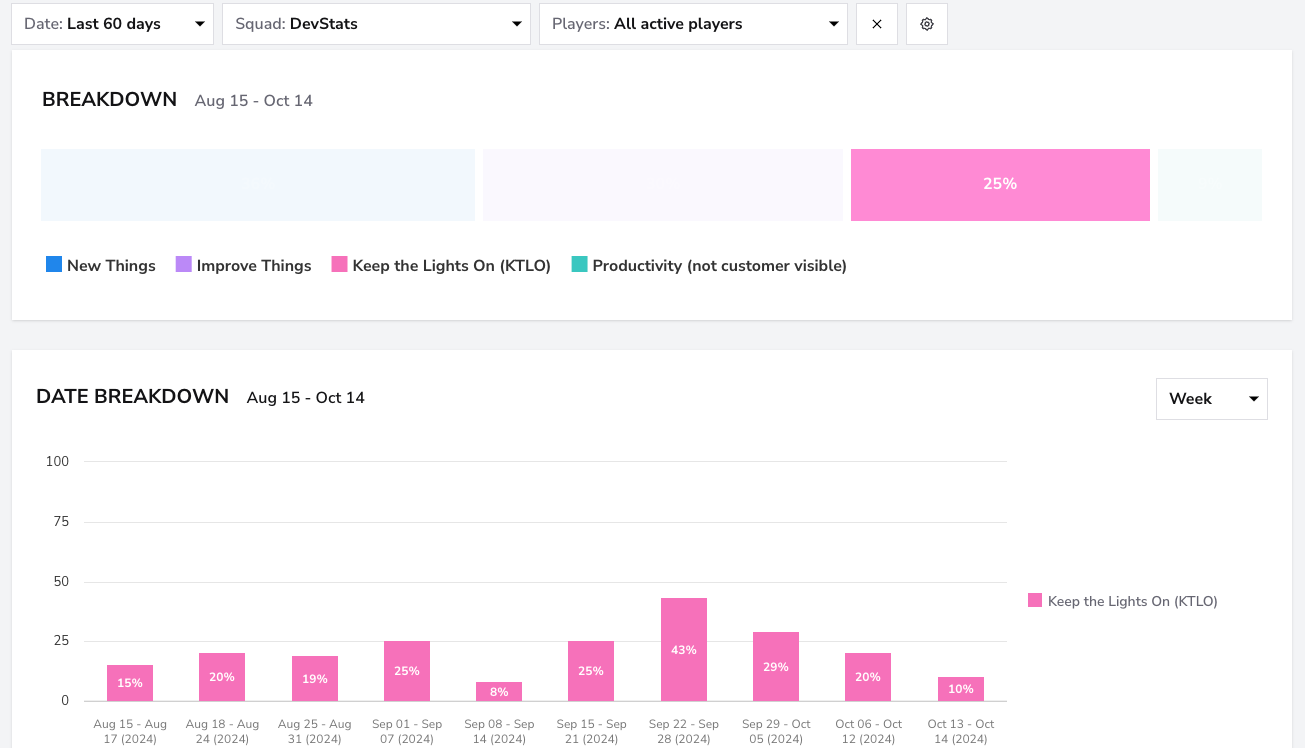
Keep the Lights On (KTLO)
- What: Displays the total number of maintenance tasks essential for maintaining service levels, such as bug fixes, security audits, and routine maintenance.
- Why it matters: This metric is crucial for maintaining the product's stability and security. Monitoring KTLO tasks ensures the team addresses essential operational needs without compromising feature development.
- How to use it: Monitor the balance between KTLO and other tasks to ensure that operational tasks do not consume excessive resources, potentially signaling the need for system optimizations or process improvements.
- Recommended issue types: BugMaintenanceHotfix
- User interface:
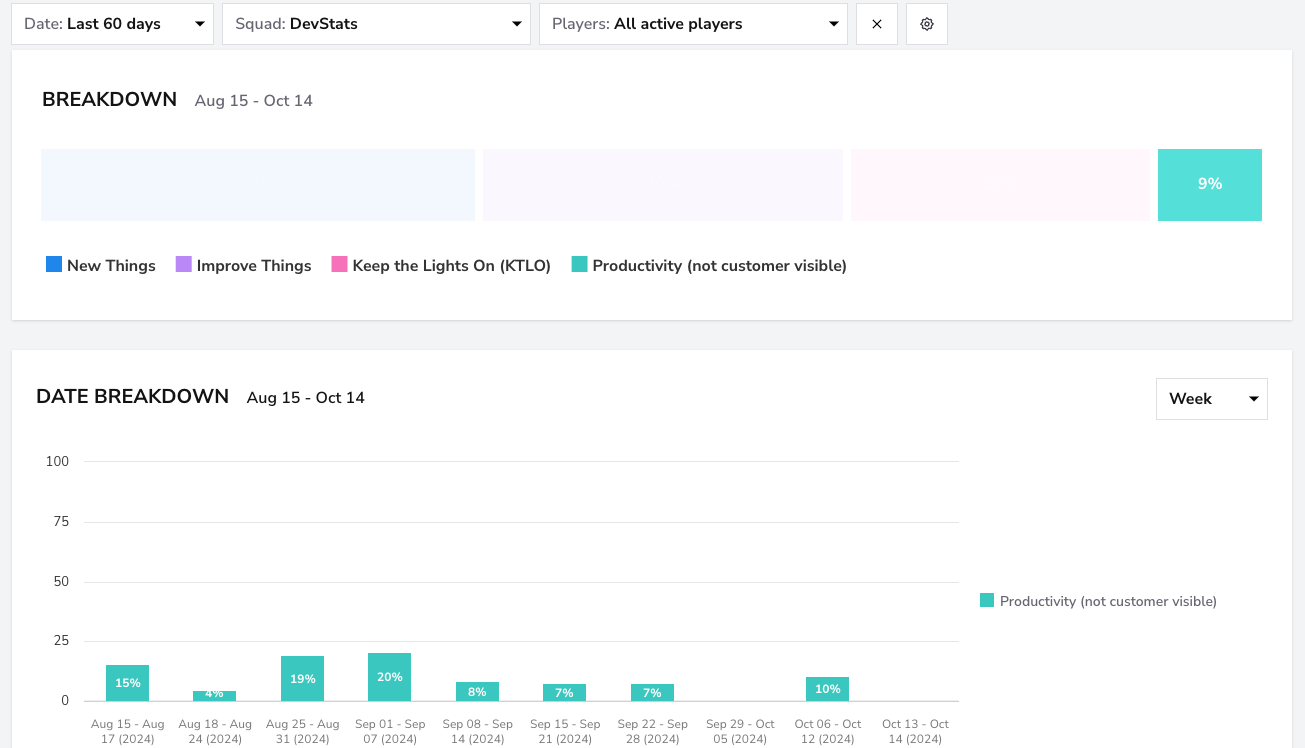
Productivity (Not Customer Visible)
- What: Displays the total number of internal tasks to improve productivity, such as reducing technical debt, enhancing developer tooling, and automating processes.
- Why it matters: This metric reflects efforts to increase overall efficiency within the team, ensuring that internal systems and processes are continuously optimized to support future growth.
- How to use it: Compare internal productivity tasks over time to balance customer-facing work and internal improvements. This helps ensure that the team is both delivering features and maintaining long-term efficiency.
- Recommended issue types: Tech DebtAutomationInternal Tooling
- User interface:
Engineering Investment Dashboard
The Engineering Investment Dashboard offers a visual overview of how engineering time is distributed across the main categories —New Things,Improve Things,Keep the Lights On (KTLO), and Productivity (Not Customer Visible).
Through the bar chart, teams can quickly see how their effort is allocated week by week or month by month, revealing where most of the engineering capacity is going and how that balance shifts over time.
This view helps squads identify trends, evaluate trade-offs between innovation and maintenance, and ensure that engineering resources are aligned with product and business goals. Each segment represents tasks grouped by issue type, allowing for consistent tracking and analysis across squads and reporting periods.
Filters
Use the Squad Filter to view the engineering investment breakdown for individual squads. If you want a broader overview of all teams, select the "All" filter to see the breakdown across all squads at once.

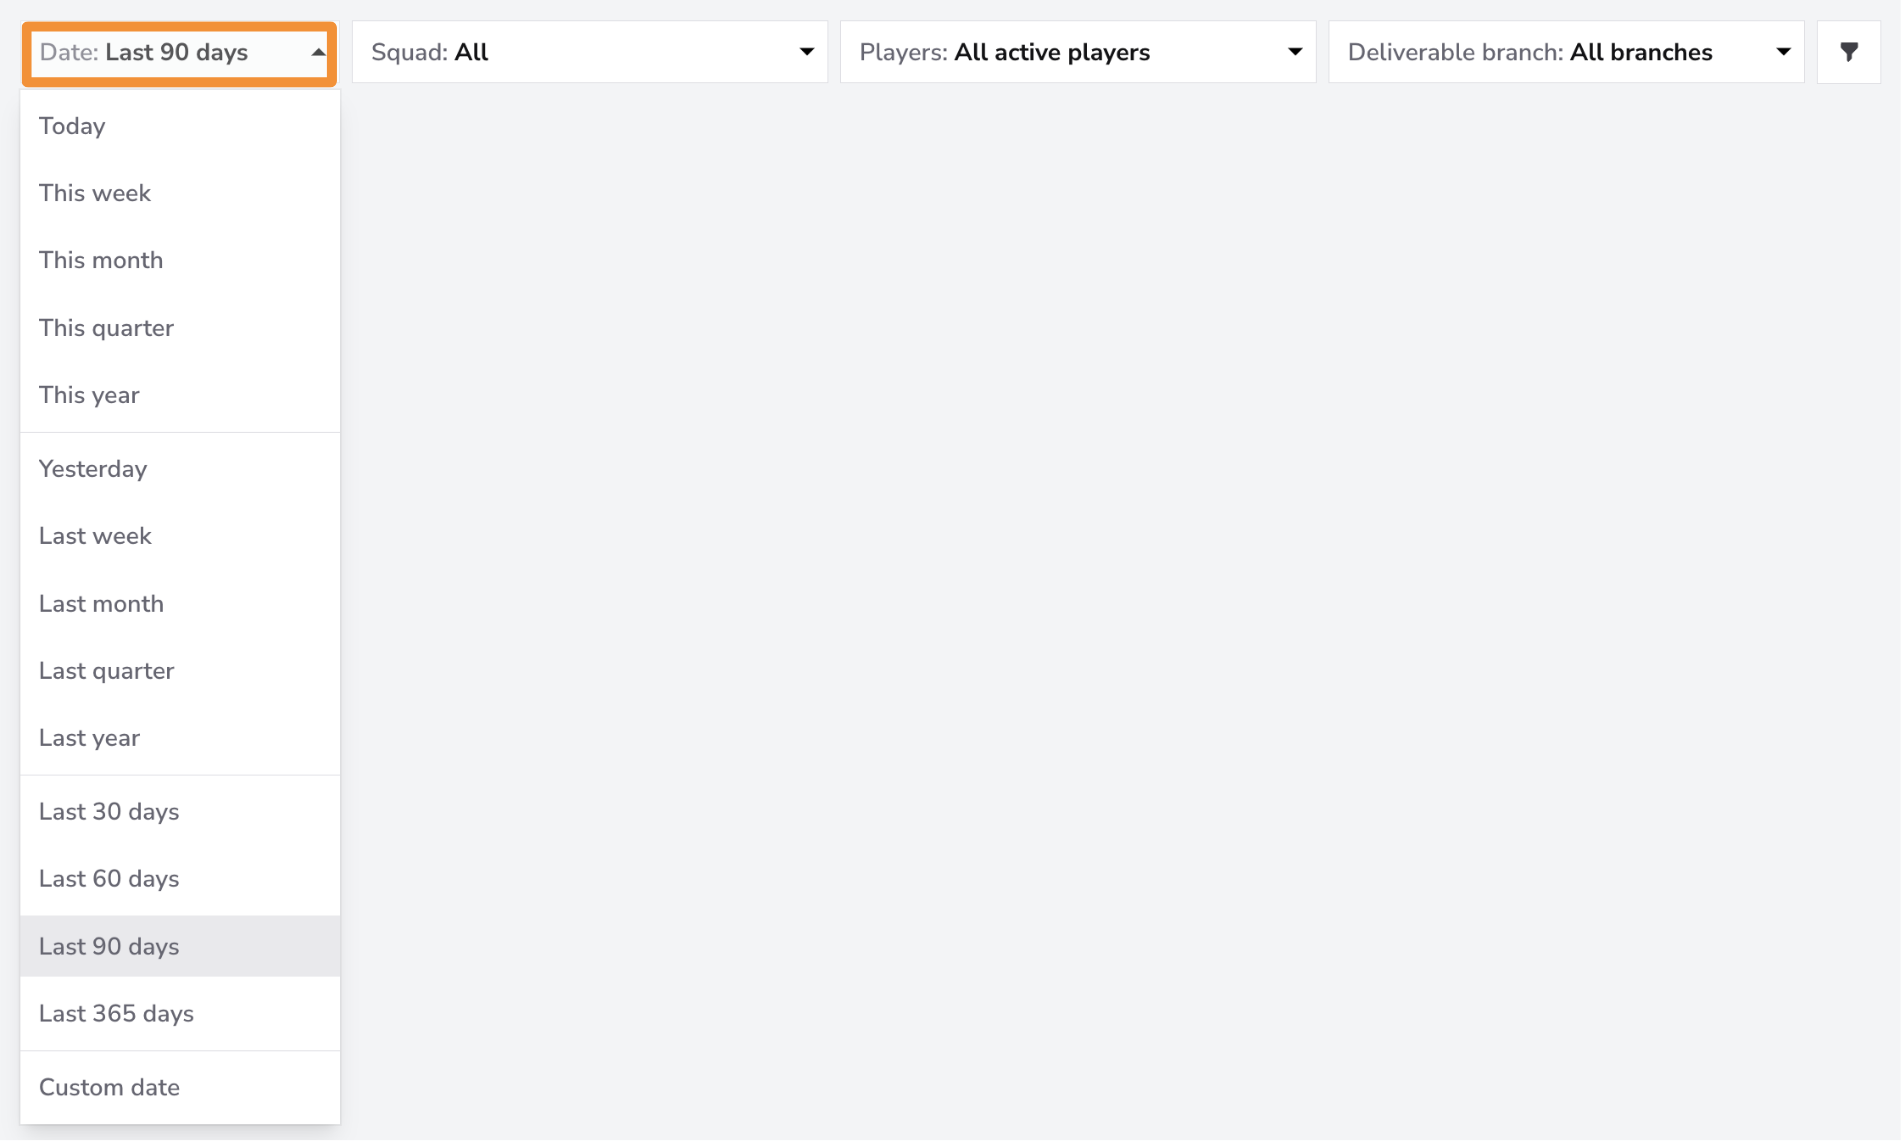
The Date Filter allows you to view data for specific time periods. You can filter for the last month, quarter, or 365 days. If you need more granular control, you can filter by a custom date range.
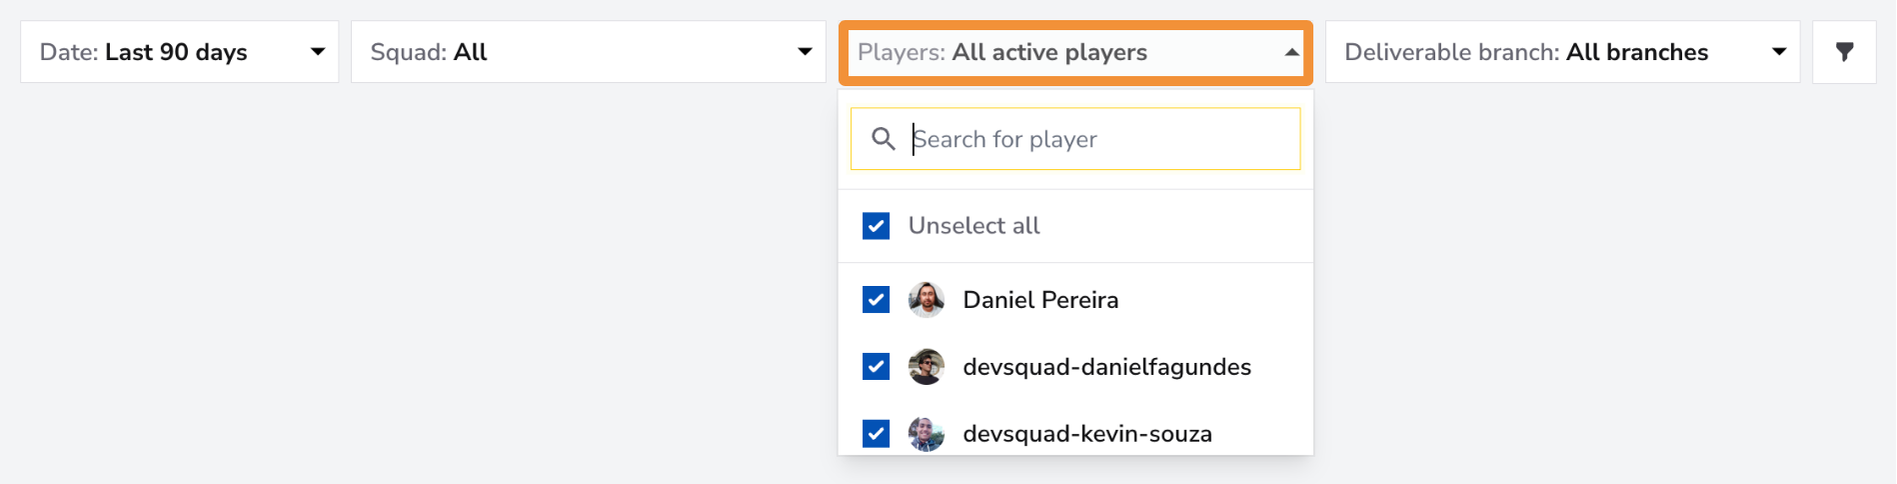
Use the Players Filter to focus on individual team members or a specific group within your squad. You can select one member for a detailed view, a group of team members if they form a sub-squad, or all team members for an overview of the entire squad's breakdown.
Controls
In this report, Controls offers Chart Settings only: enable Trendline or Regression line to inspect patterns in the chart. Statistical Measure and PR Cycle Time Stages are not available; these options do not change how the report metrics are calculated.
Click the adjustments button on the Controls bar and select Save after choosing your options. See the Controls guide for details.
Explore Guides and Best Practices
Conclusion
The Engineering Investment feature provides a clear view of how engineering resources are allocated across areas like new features, improvements, maintenance, and productivity tasks. By tracking resource distribution, teams can balance customer-facing development with internal improvements, ensuring better overall efficiency and workflow management.