What is the Investment Profile Feature?
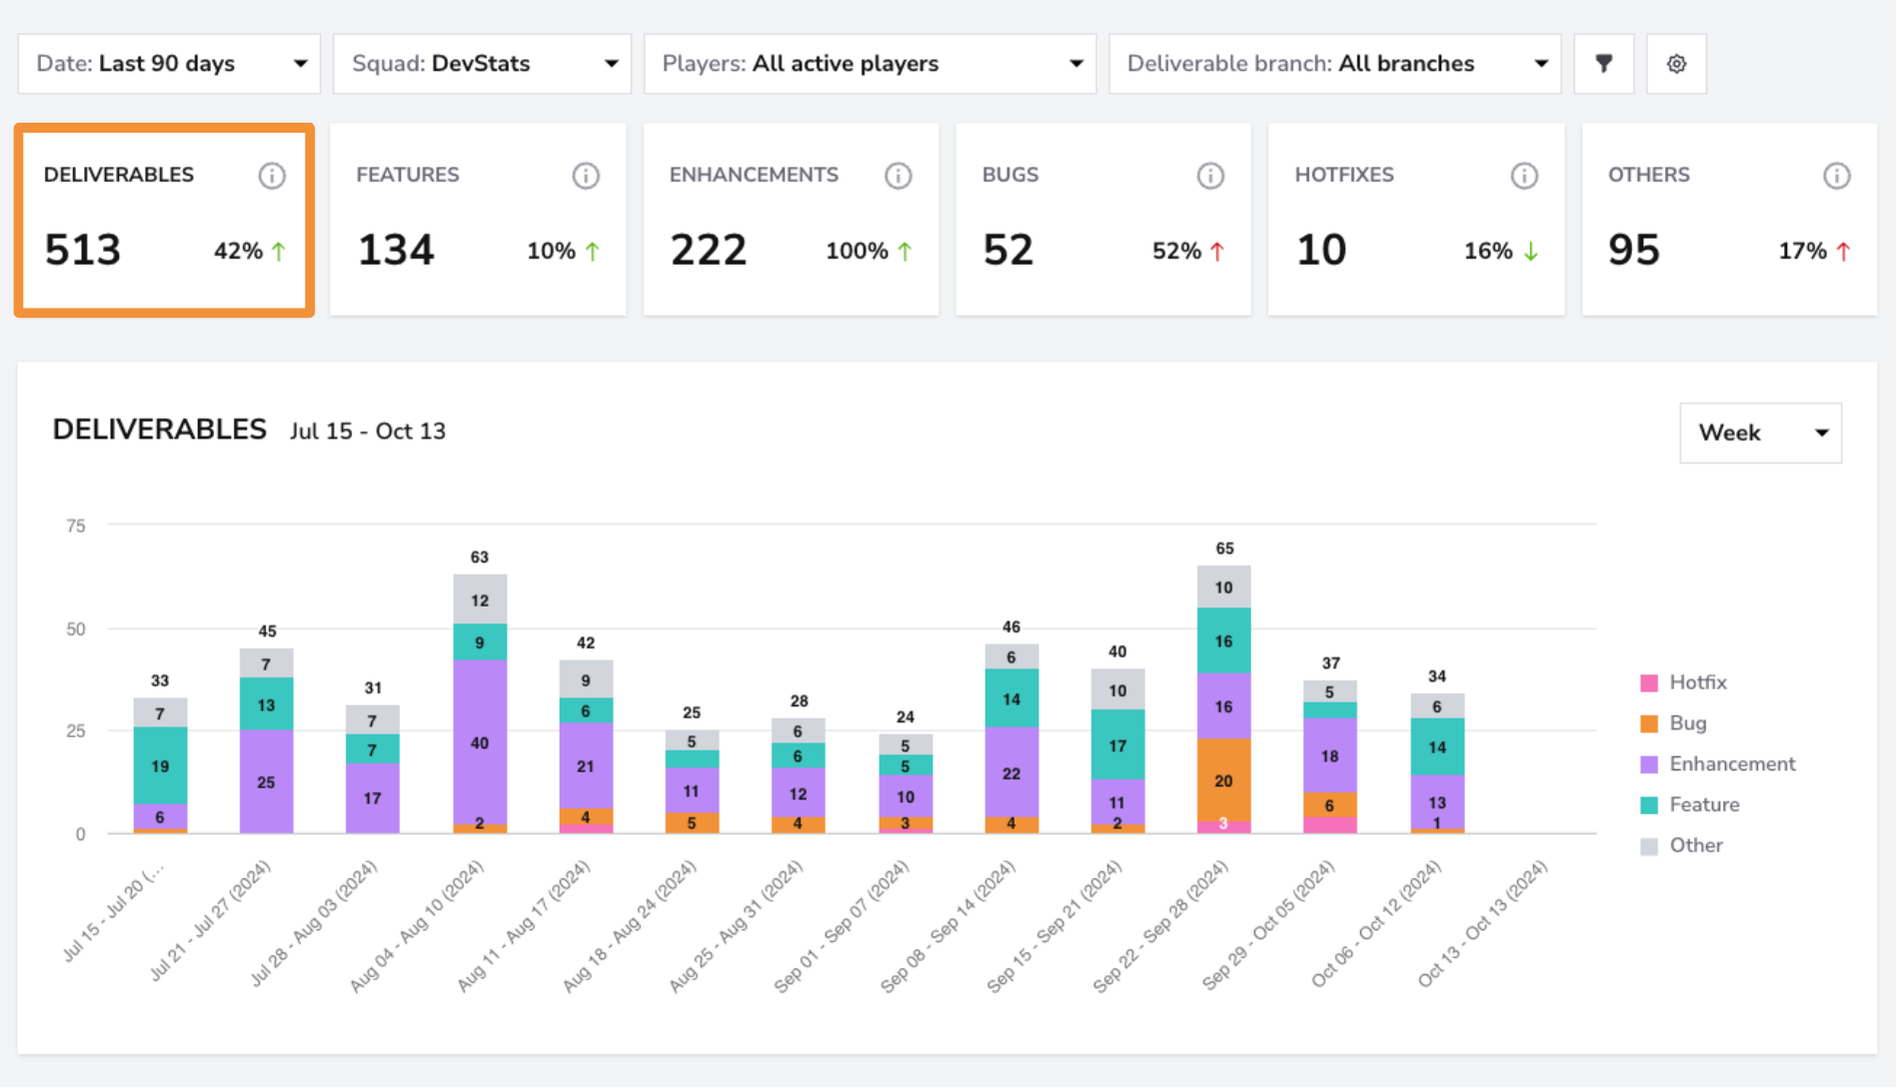
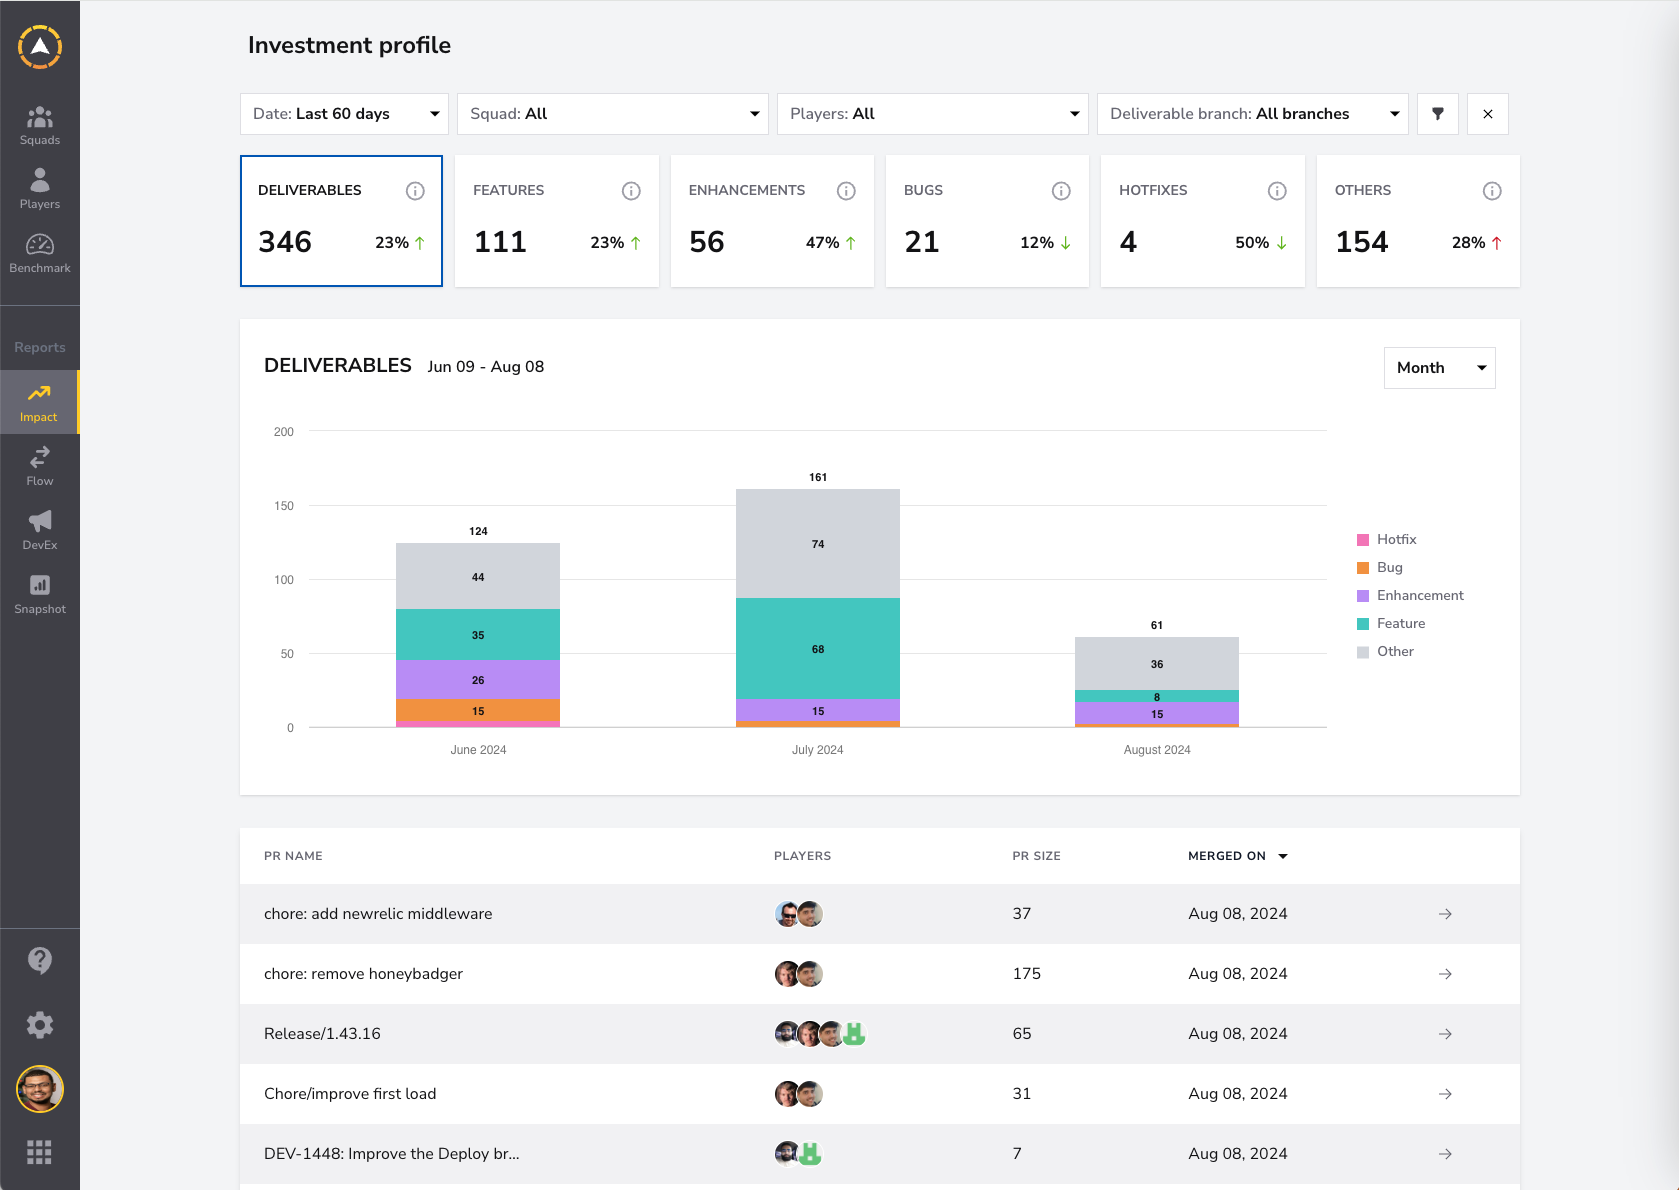
The Investment Profile feature offers a high-level overview of your team's deliverables, including new features, enhancements, bug fixes, and hotfixes, within a selected time period. It provides key metrics and visual representations to help teams track progress, analyze task distribution, and improve future planning and execution.
If your dashboard is missing deliverables or only showing a partial view, you may need to adjust your branch tracking settings. Follow this how-to guide to quickly reconfigure the tracking strategy to better fit your team's needs—it only takes two minutes!
Metrics
The Investment Profile feature provides a comprehensive set of metrics to track and analyze your team's deliverables.
Total Deliverables
- What: Displays the total number of deliverables (features, enhancements, bugs, hotfixes, etc.) completed within the selected period.
- Why it matters: It offers a clear view of the team's output, detailing the types of work completed and how they compare to previous periods.
- How to use it: Compare the number of deliverables across different periods to identify trends in your team's productivity and assess whether output is increasing or decreasing.
- User interface:
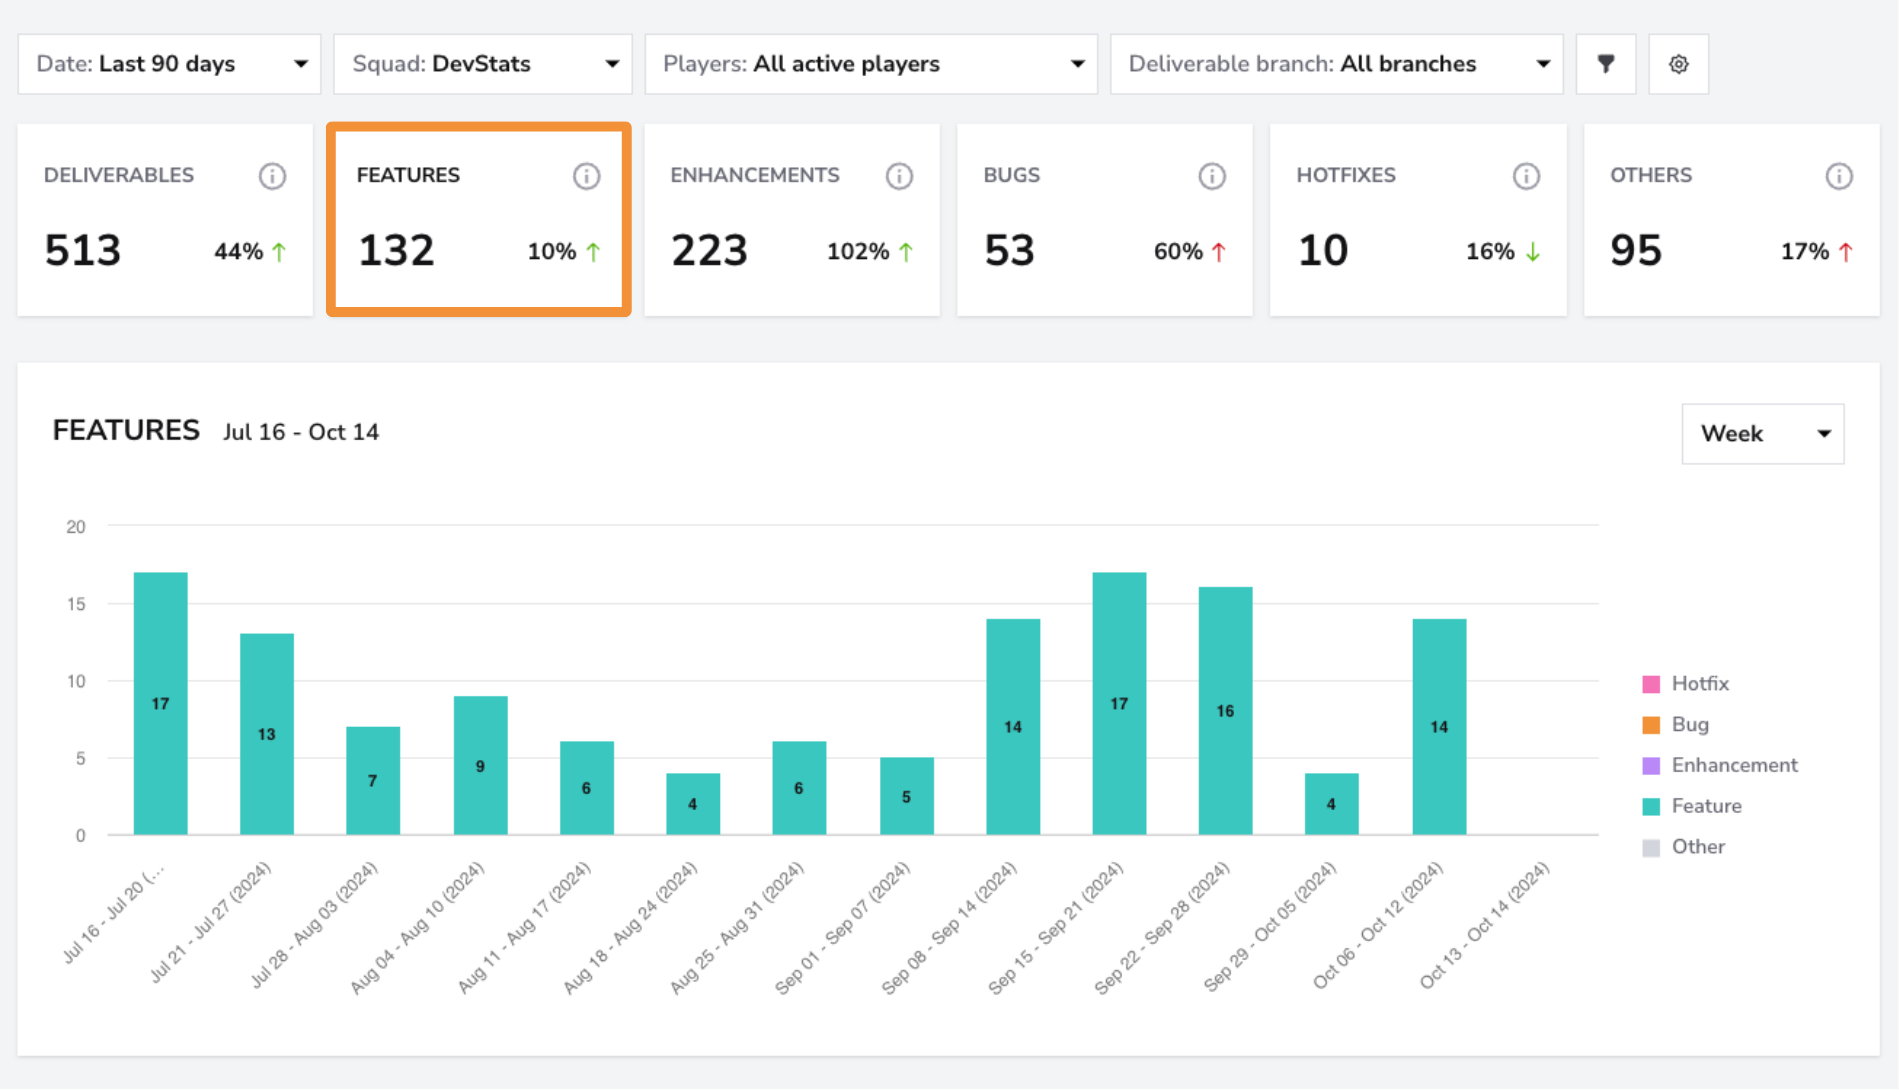
Enhancements
- What: Displays the total number of enhancements made to existing features or systems.
- Why it matters: Enhancements improve existing functionality, and tracking them helps ensure continuous improvements to the product's usability and performance.
- How to use it: Analyze enhancements completed over time to gauge whether enough attention is being paid to refining and improving the current system alongside building new features.
- User interface:
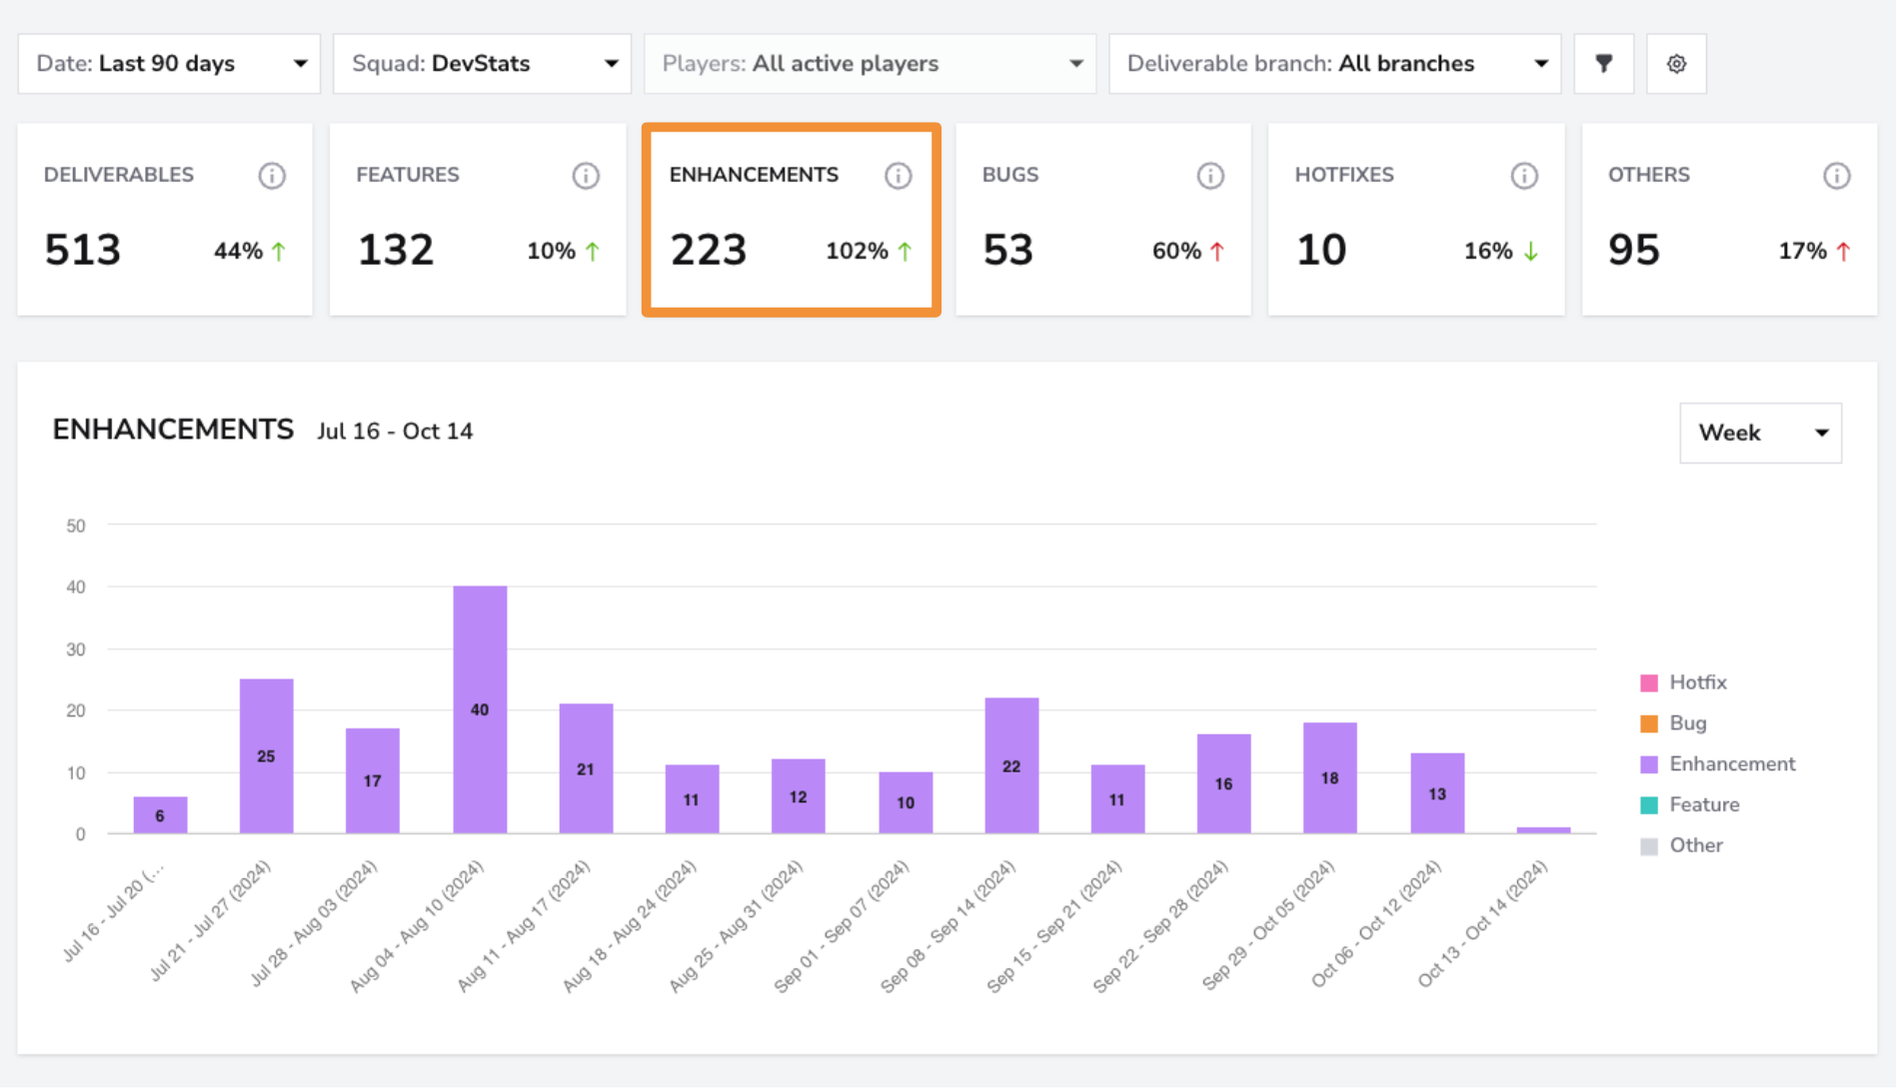
Hotfixes
- What: Displays the total number of urgent fixes applied to resolve critical issues.
- Why it matters: Hotfixes are used to quickly address critical issues that affect users. Tracking them helps measure your team's responsiveness to urgent problems.
- How to use it: An increasing number of hotfixes may indicate declining quality due to inadequate testing, rising technical debt, or overplanning in sprints, which can negatively impact the quality of new features. It's best to combine this metric with others, such as sprint carryover tasks, for a more comprehensive understanding of team performance.
- User interface:
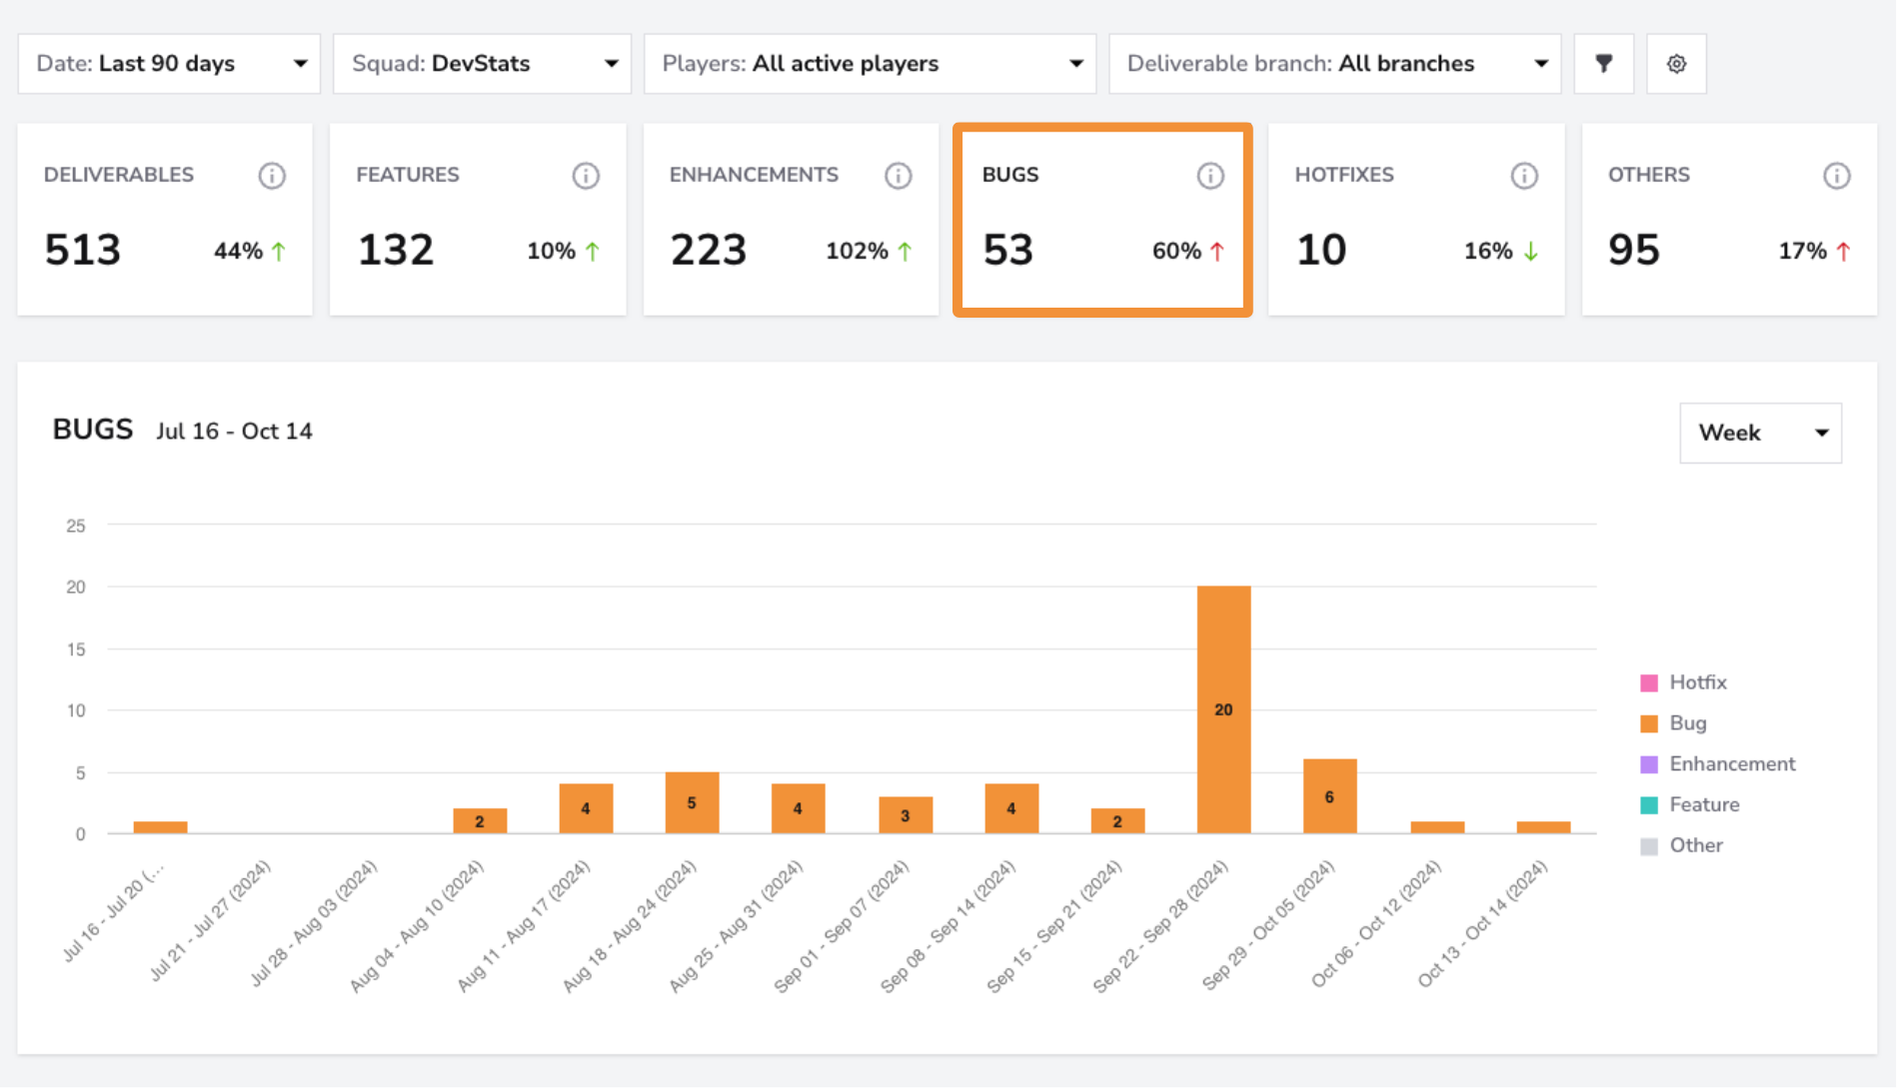
Others
- What: Includes other types of deliverables that don't fall under features, enhancements, bugs, or hotfixes.
- Why it matters: This metric tracks miscellaneous tasks, such as chore or operational tasks, that still contribute to the team's workload.
- How to use it: Monitor this category to ensure that non-feature tasks are appropriately balanced with product development and bug fixes.
- User interface:
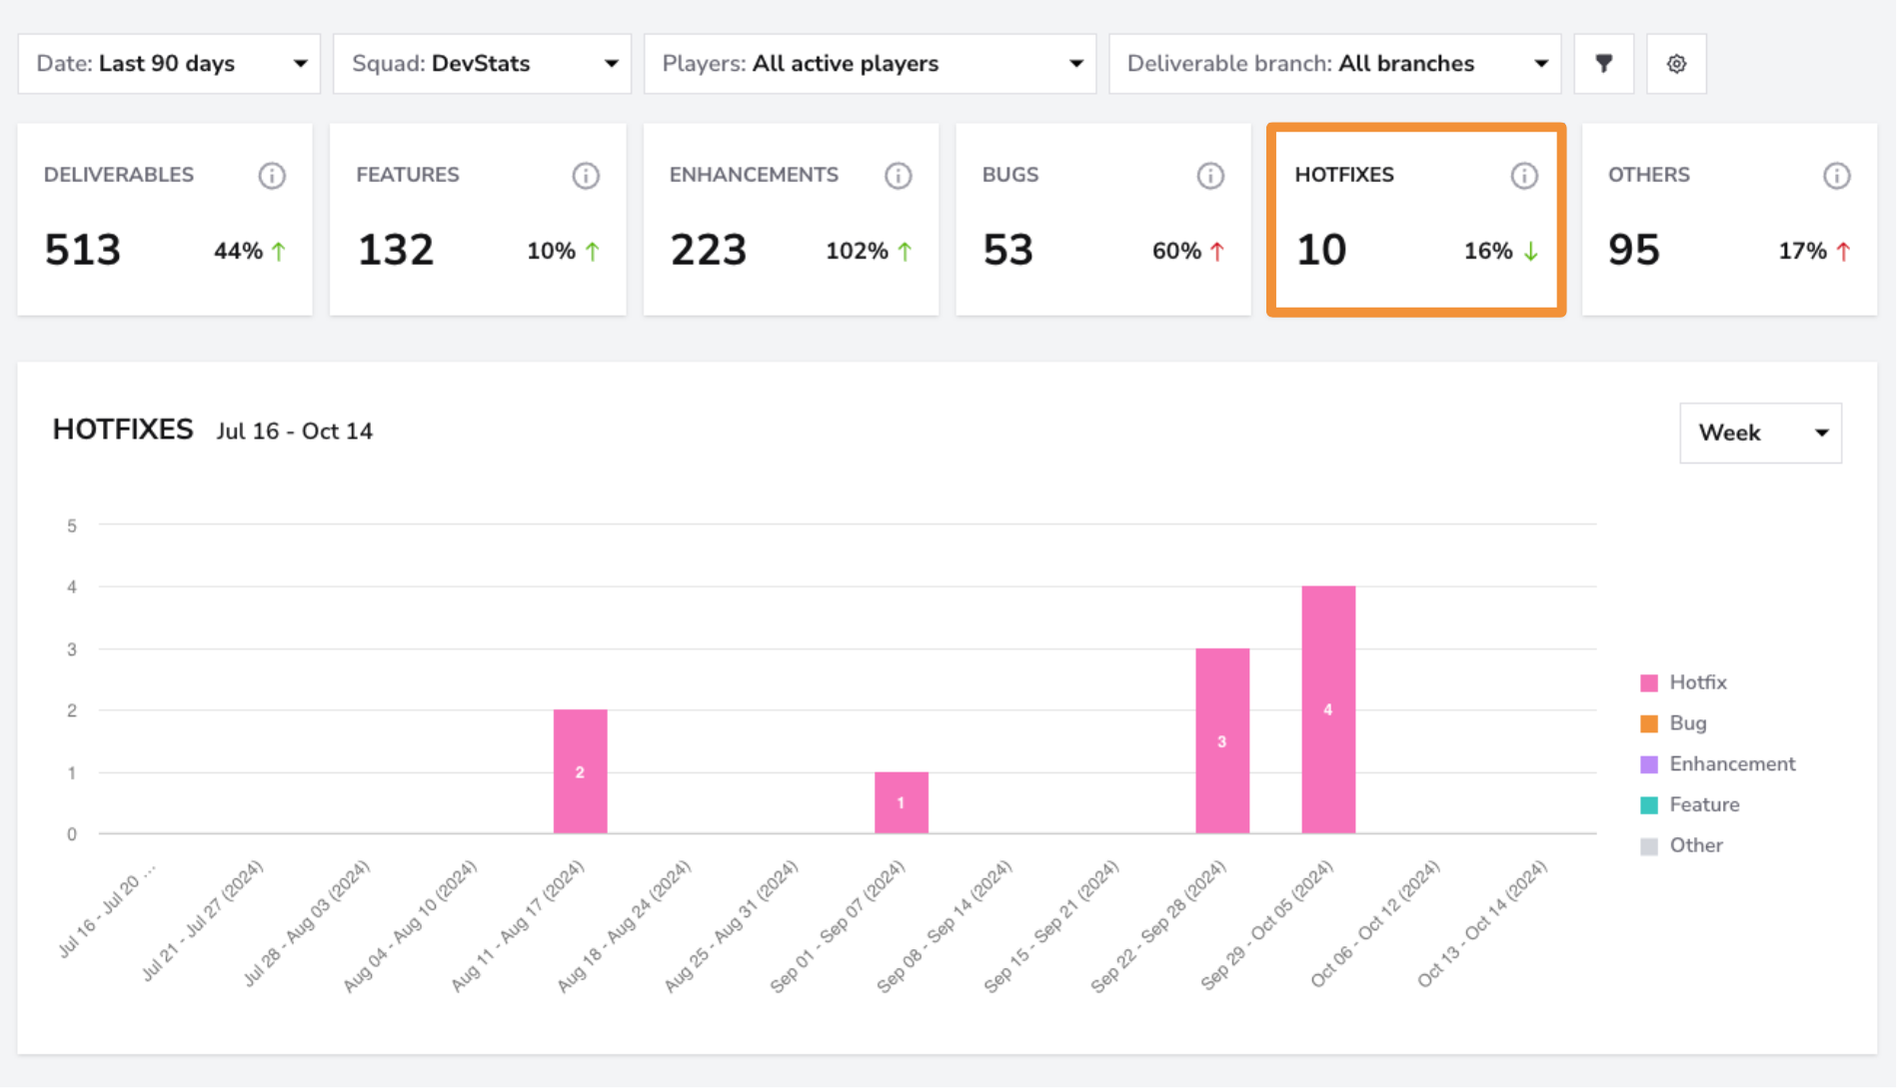
Investment Profile Dashboard
The Investment Profile feature includes a bar chart that provides a visual representation of deliverables over a selected period. Each bar represents a deliverables breakdown for the selected period, which can be broken down into days, weeks, or months. Below the chart, you can find a list of all PRs. If you click on the arrow next to one of the PRs, you'll get a detailed overview of that PR.
Filters
Use the Squad Filter to view sprint planning and execution metrics for individual squads. If you want a broader overview of all teams, select the "All" filter to see the performance across all squads at once.

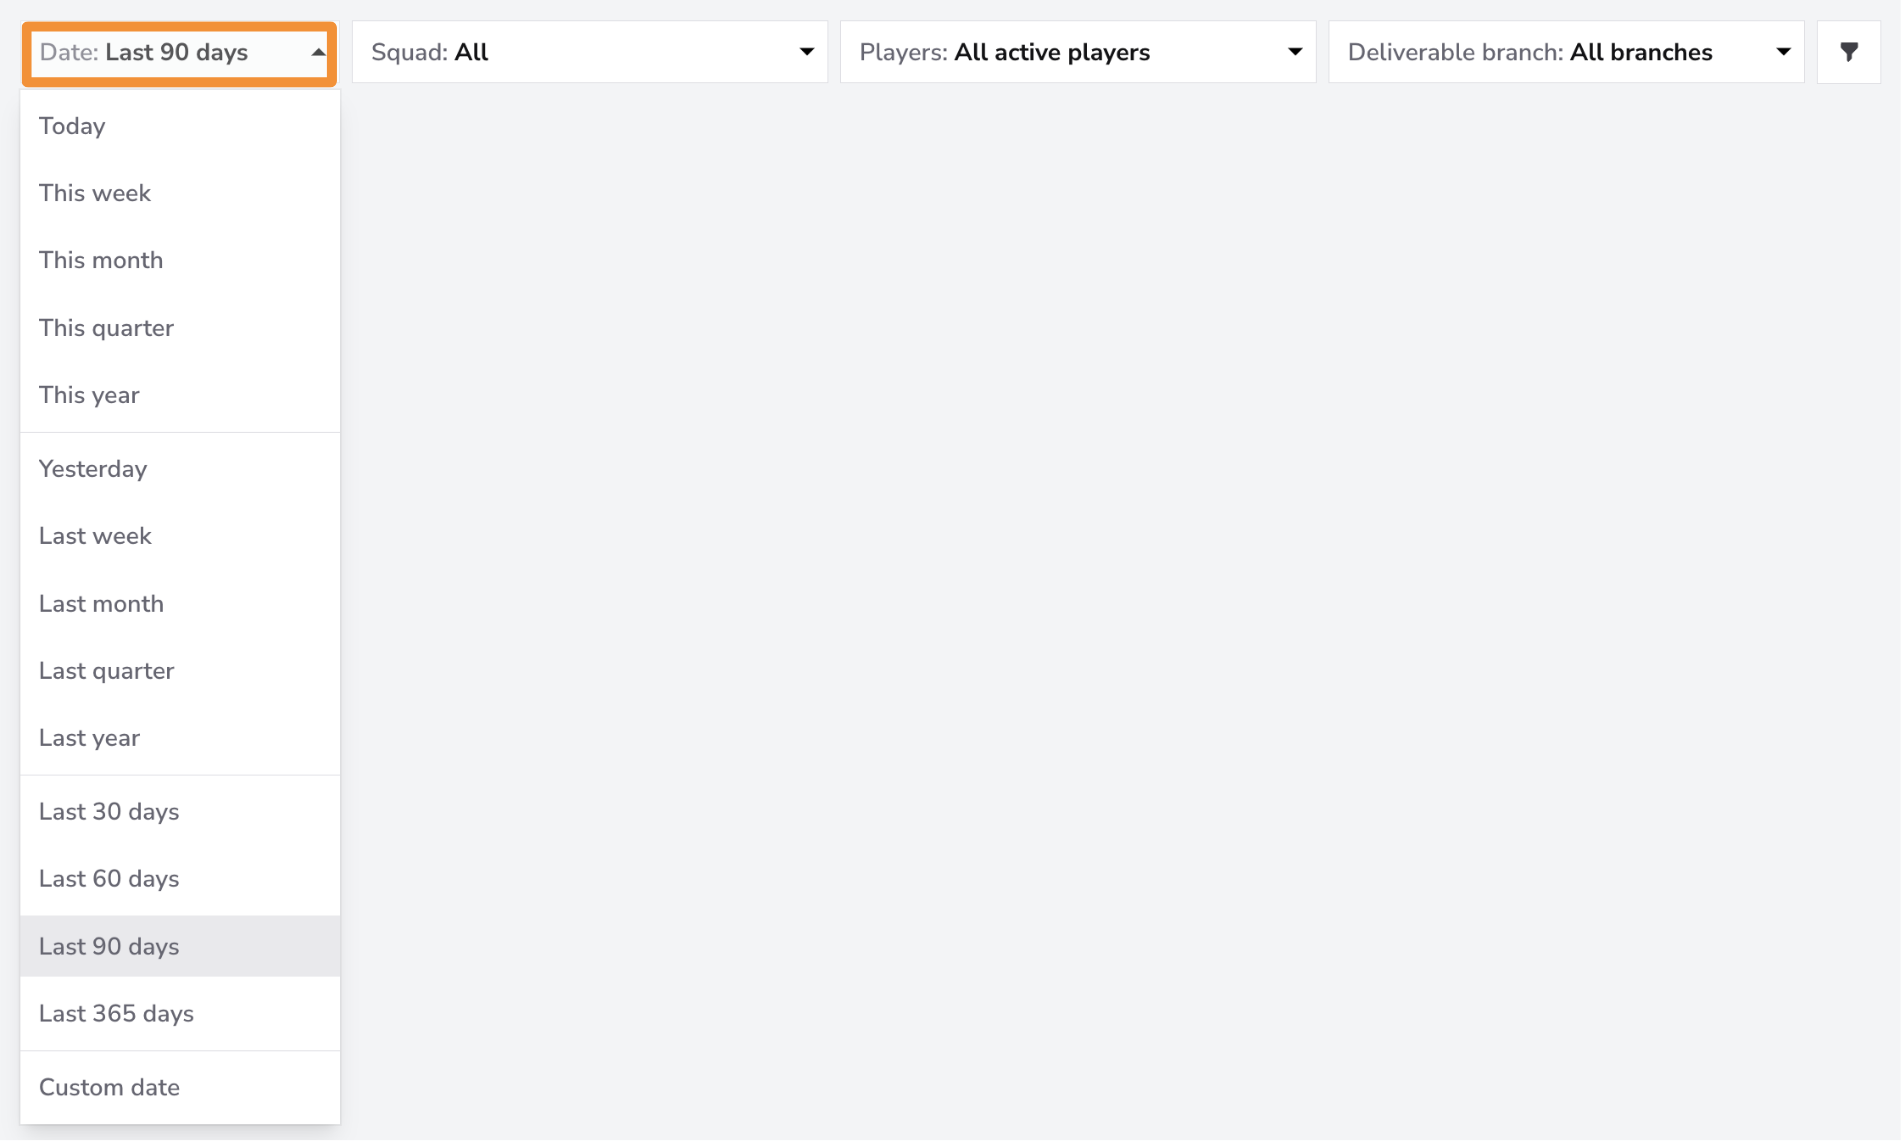
The Date Filter allows you to view data for specific time periods. You can filter for the last month, quarter, or 365 days. You can filter by a custom date range if you need more granular control.
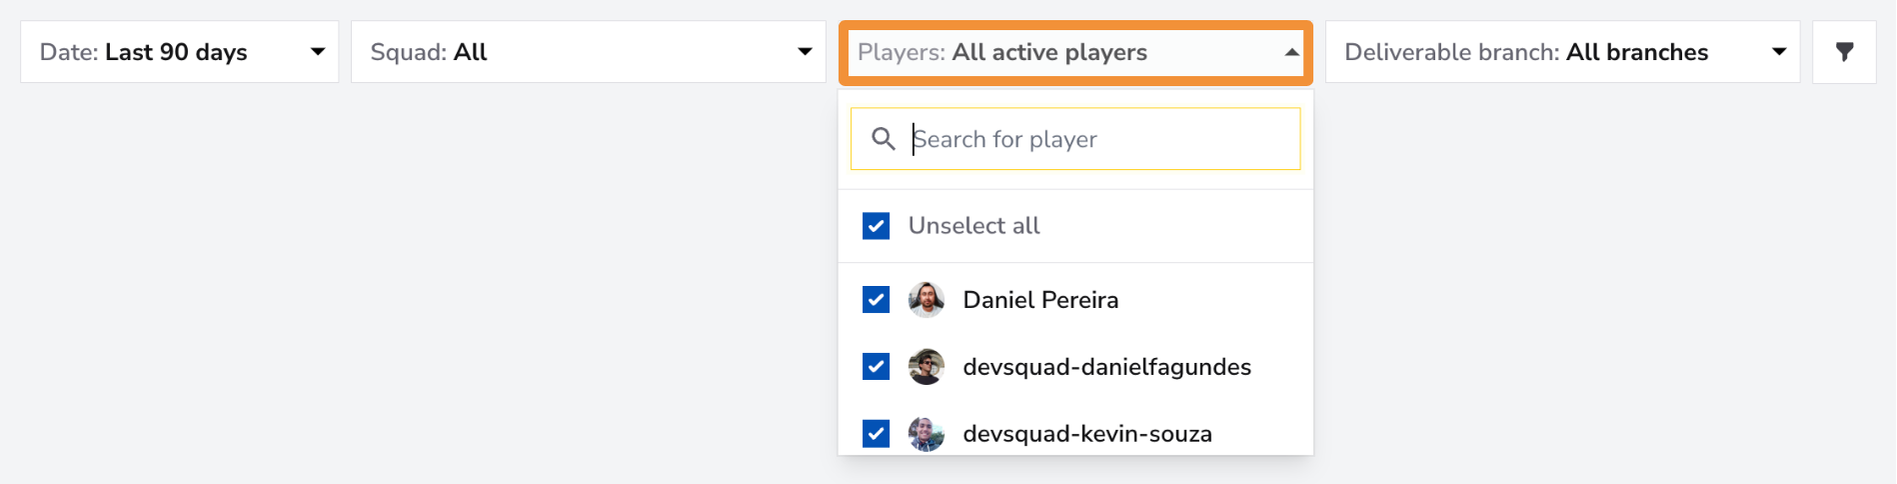
Use the Players Filter to focus on individual team members or a specific group within your squad. You can select one member for a detailed view, a group of team members if they form a sub-squad, or all team members for an overview of the entire squad's performance.
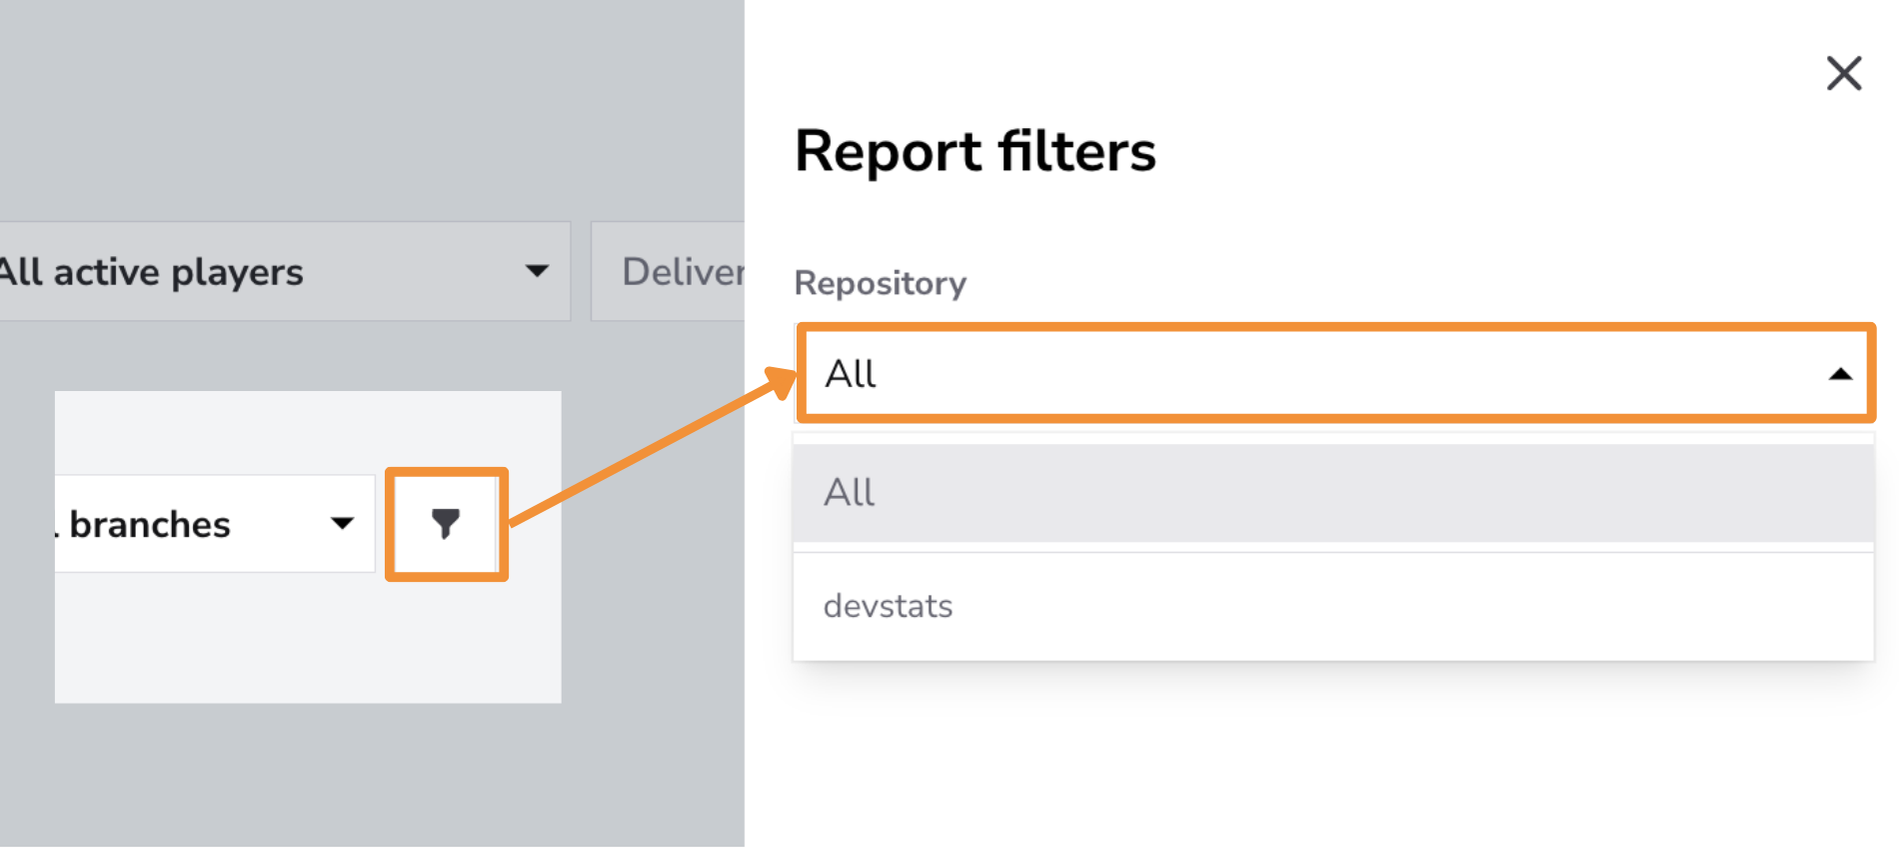
Use the Repository Filter to focus on specific repositories or view deliverables across all repositories. This is particularly useful when you want to analyze work done in individual repositories, such as focusing on a key repository for a specific project or feature. By filtering at this level, you can track deliverables and performance within the context of specific codebases.
Use the Data Source Filter to refine deliverables based on the origin of the data, whether from a Git provider or a project management tool.
- Git provider: Filters deliverables sourced from version control systems, such as code commits and pull requests.
- Project management: Filters deliverables sourced from project management tools, such as tasks, bugs, or user stories.
Controls
In this report, Controls offers Chart Settings only: enable Trendline or Regression line to inspect patterns in the chart. Statistical Measure and PR Cycle Time Stages are not available; these options do not change how the report metrics are calculated.
Click the adjustments button on the Controls bar and select Save after choosing your options. See the Controls guide for details.
Explore Guides and Best Practices
Conclusion
The Investment Profile feature offers teams a clear and comprehensive view of their deliverables, including features, enhancements, bug fixes, and hotfixes. It provides detailed metrics and visual tools to track progress, identify trends, and improve future planning.
By using advanced filters and visual representations, teams can enhance visibility, streamline task management, and boost overall efficiency, leading to more informed decision-making and better outcomes.