Overview
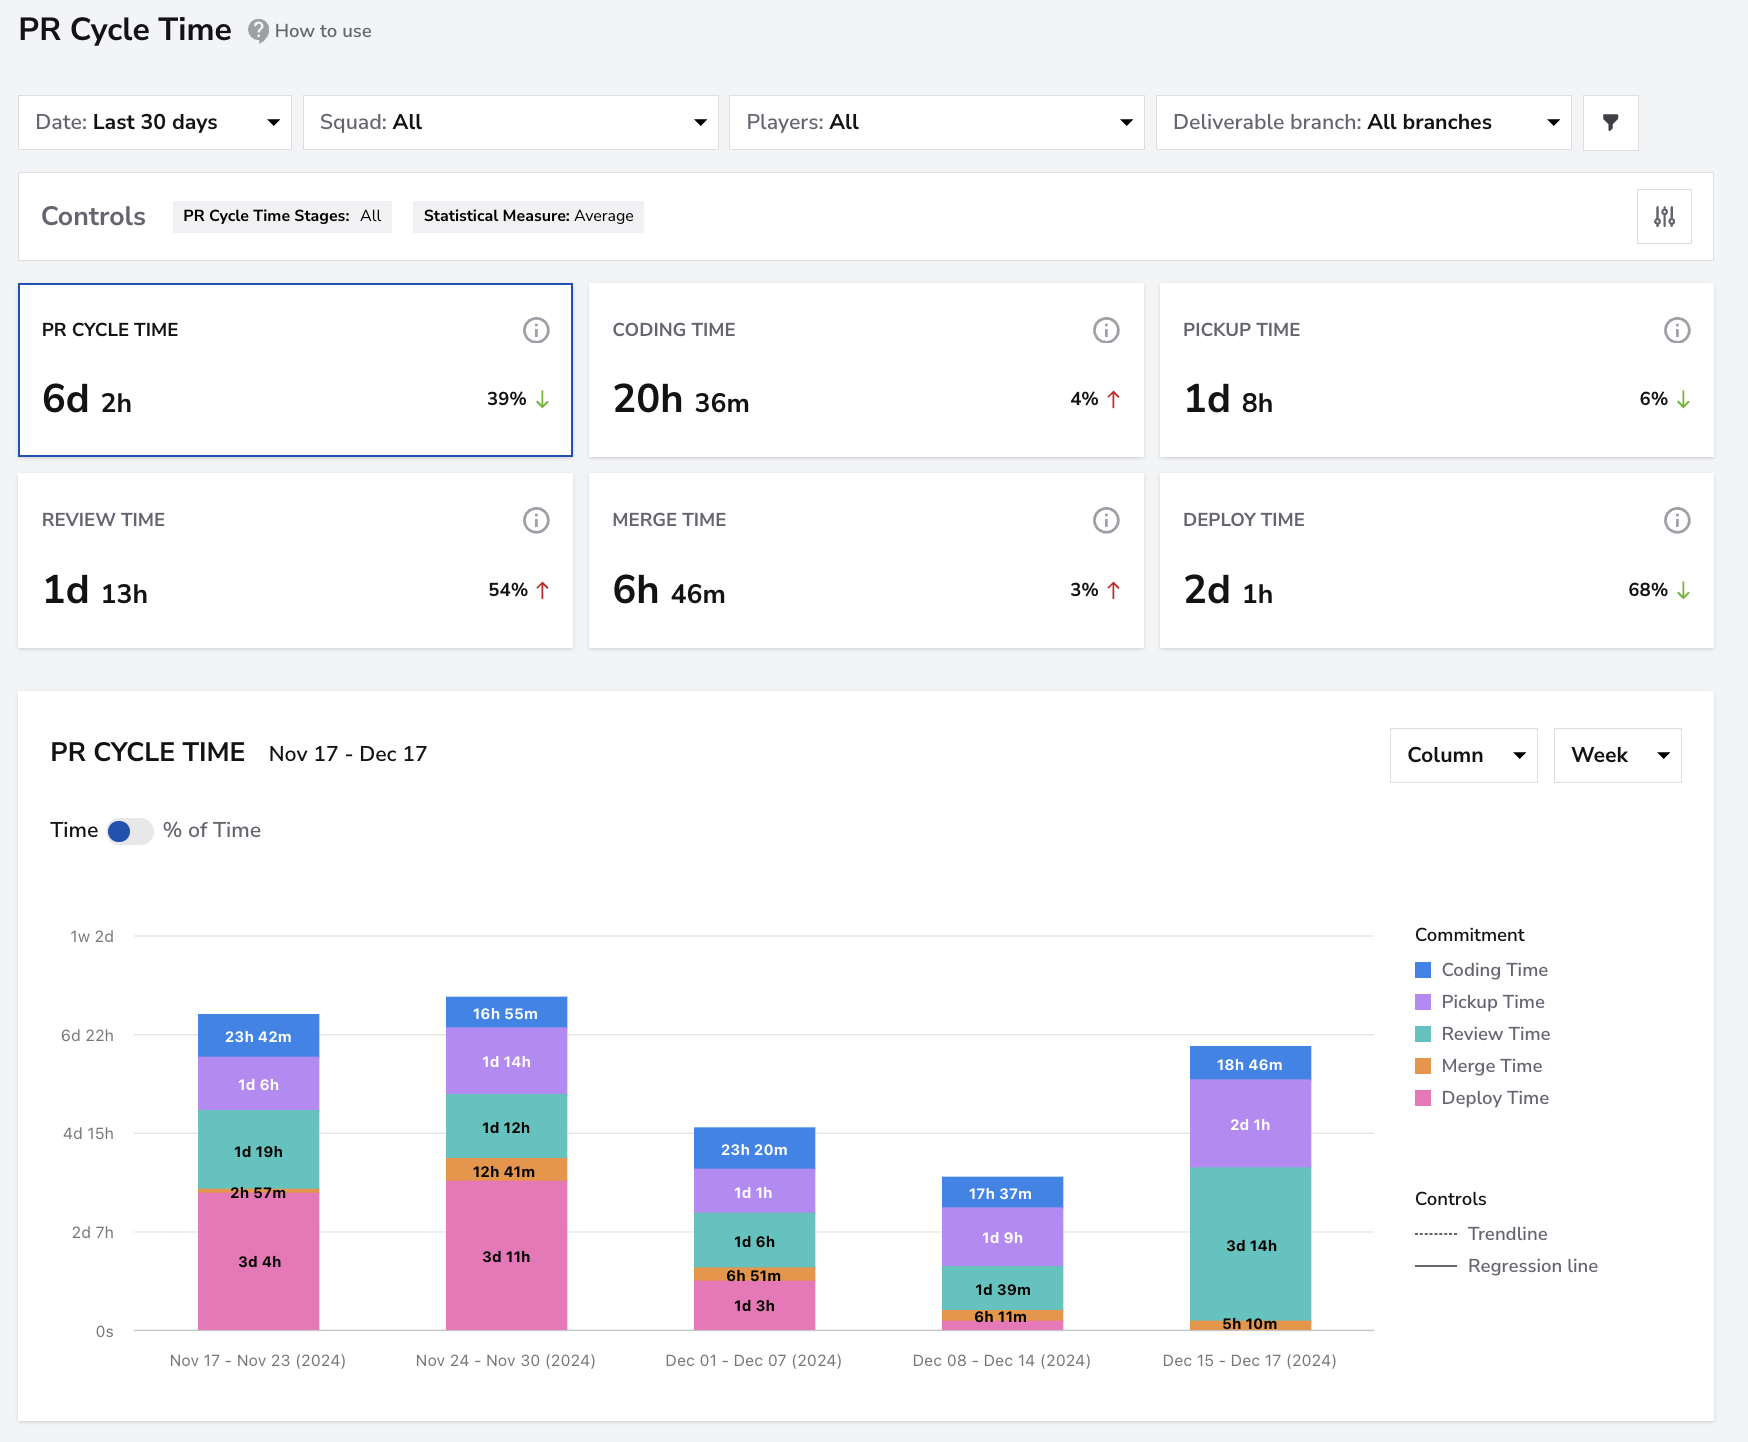
High-performing teams deliver value continuously, not just by coding faster but by reducing friction between development and deployment. The Pull Request Cycle Time report in DevStats provides full visibility into how work moves from the first commit to production, helping teams identify bottlenecks, measure delivery performance, and make data-driven improvements to their engineering flow.
Why It Matters
The Pull Request Cycle Time measures the time between the first commit and deployment.
A shorter cycle time means faster delivery and more frequent opportunities to validate assumptions, improve quality, and reduce risk.
This metric is influenced by several factors:
- Review process and reviewer availability
- Amount of work in progress
- Manual testing or QA handoffs
- Cross-team dependencies
- Codebase complexity and context switching
Cycle Time is a system-level metric, not an individual performance measure. Longer times for senior engineers often indicate that they’re handling more complex or cross-cutting work, not inefficiency.
Setup Requirements
To start improving your PR flow in DevStats, ensure that:
- Your Git Provider is connected
- At least one squad is configured
- Your deployments are being tracked, either automatically or (optional) through the API
- Your incidents are being correctly tracked, either via branch prefix, (optional) Incident Manager or API.
Using DevStats
Navigate the Dashboard
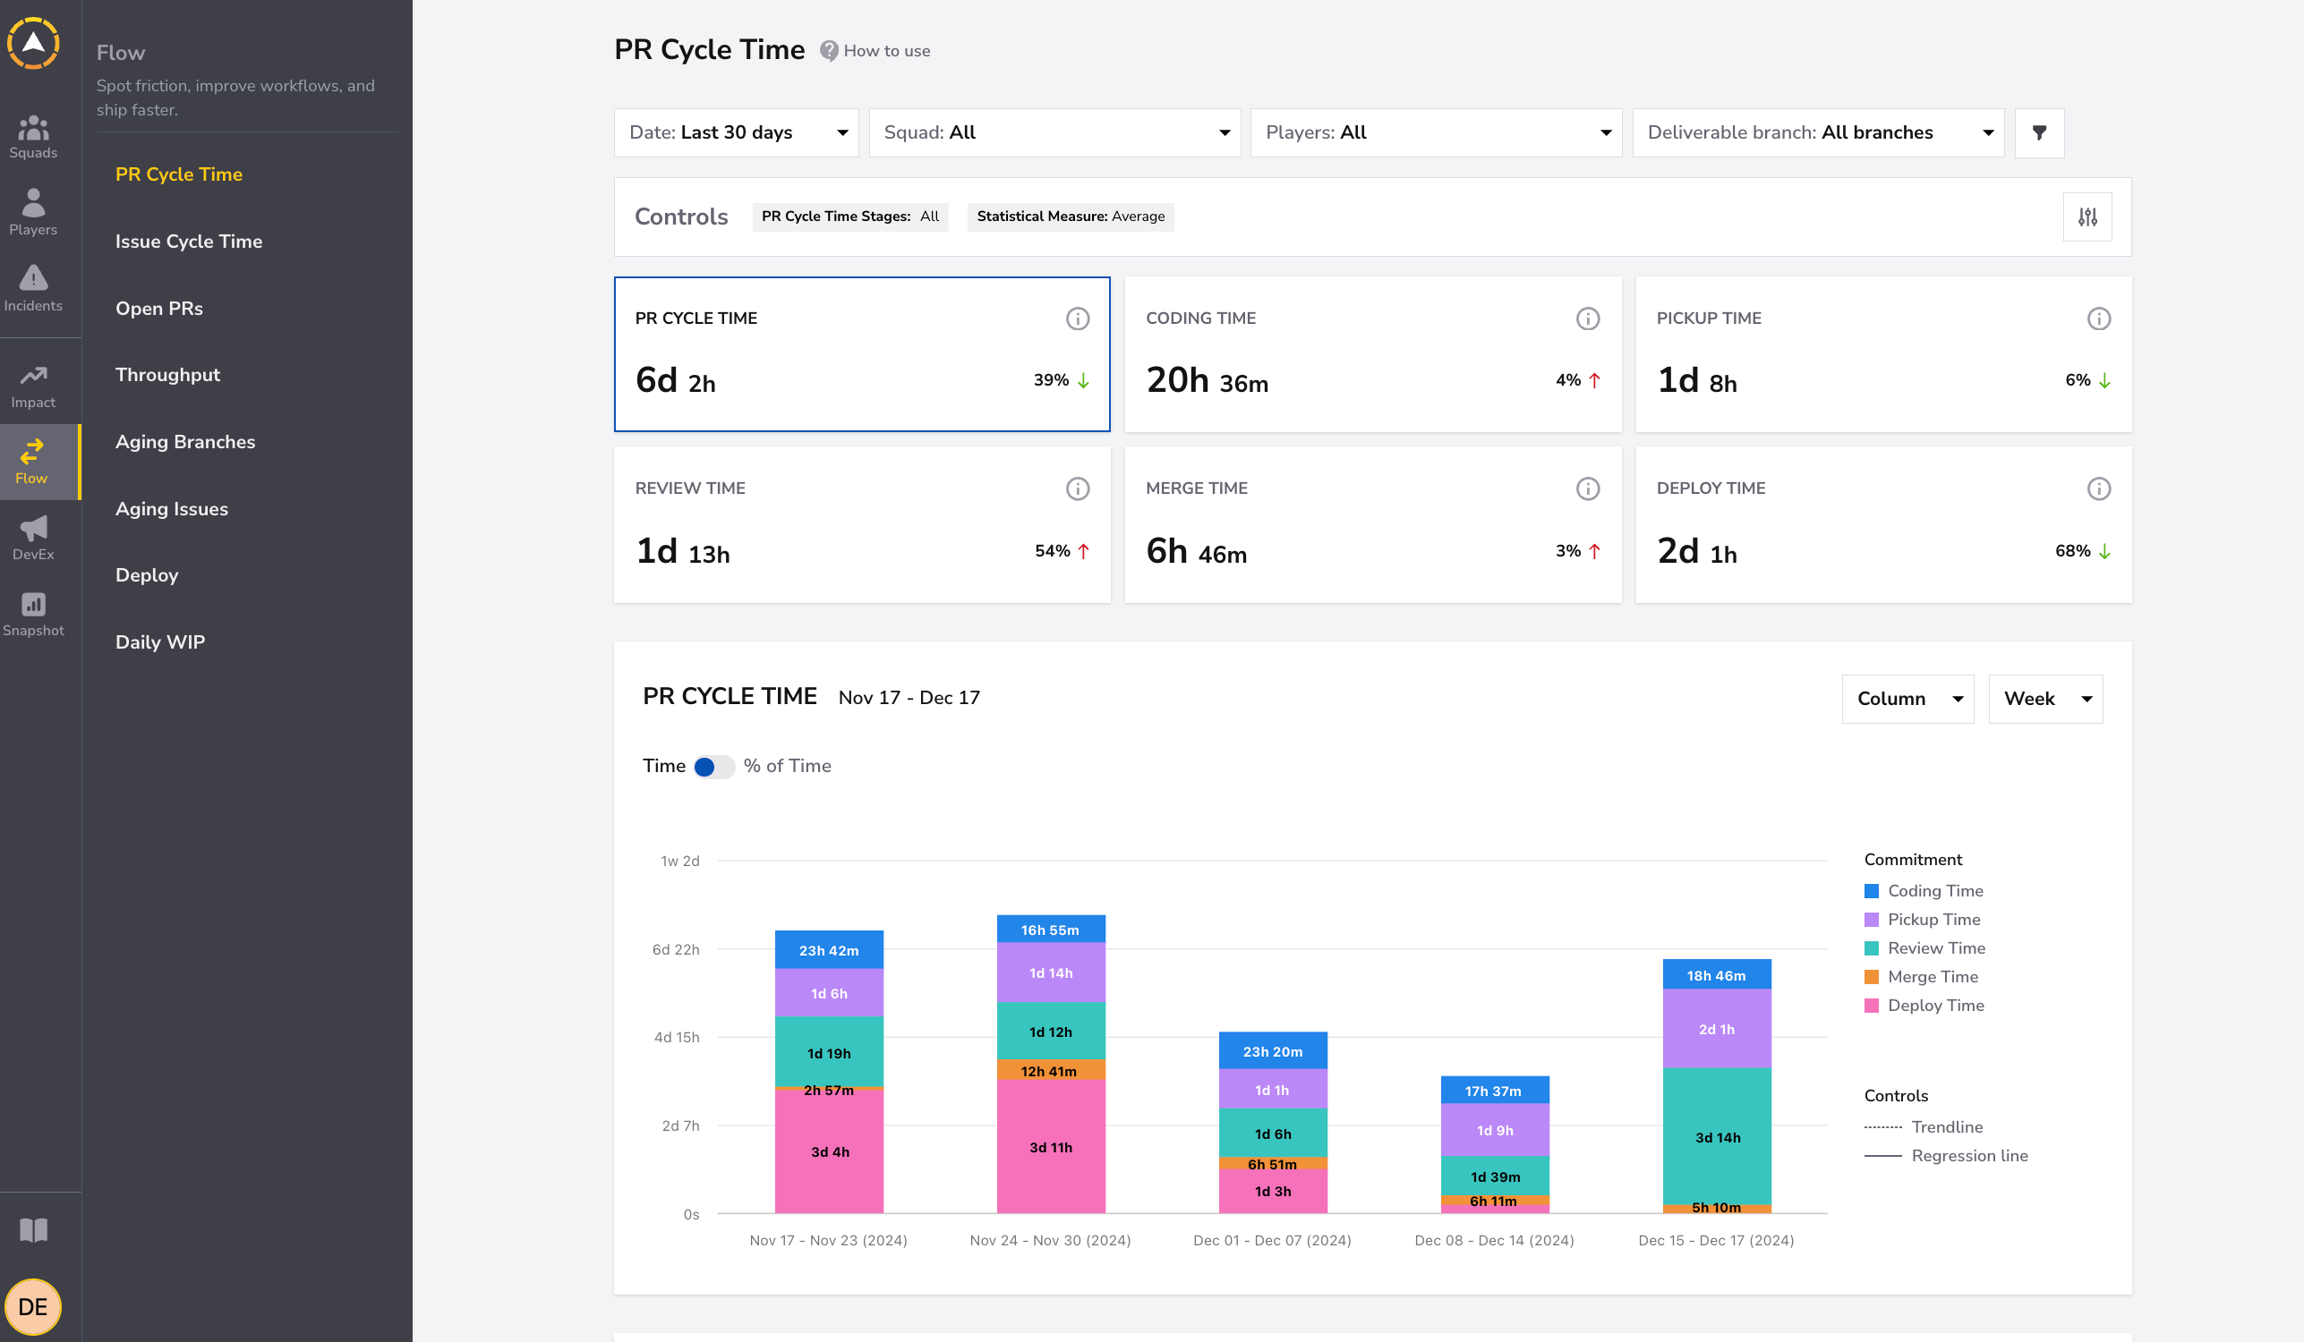
Open the PR Cycle Time Dashboardunder the Flow section.
This dashboard provides a detailed overview of how pull requests progress from creation to deployment, allowing teams to monitor delivery speed and workflow efficiency in real time.
Understand the Stages
Each stage in the PR lifecycle represents a key part of the development process: Coding Time– from the first commit to PR creation Pickup Time– from PR creation until the first review Review Time– from the first review to the last review Merge Time– from the last review to the first merge Deploy Time – from the first merge until the PR is merged into the deployment branch
These metrics show where time is being spent and help identify which phase contributes the most to total cycle time.
Analyze Your Data
Use filters by team,repository, or date range to focus your analysis on specific contexts.
Combine these filters with the Controls panel to select statistical measures (e.g., 85th Percentile) and visualize how delivery performance evolves across stages. Drill down into specific pull requests to understand where delays are occurring and uncover root causes such as review bottlenecks or long merge queues.
You can also switch the chart view to Scatter mode to visualize individual pull requests as data points.
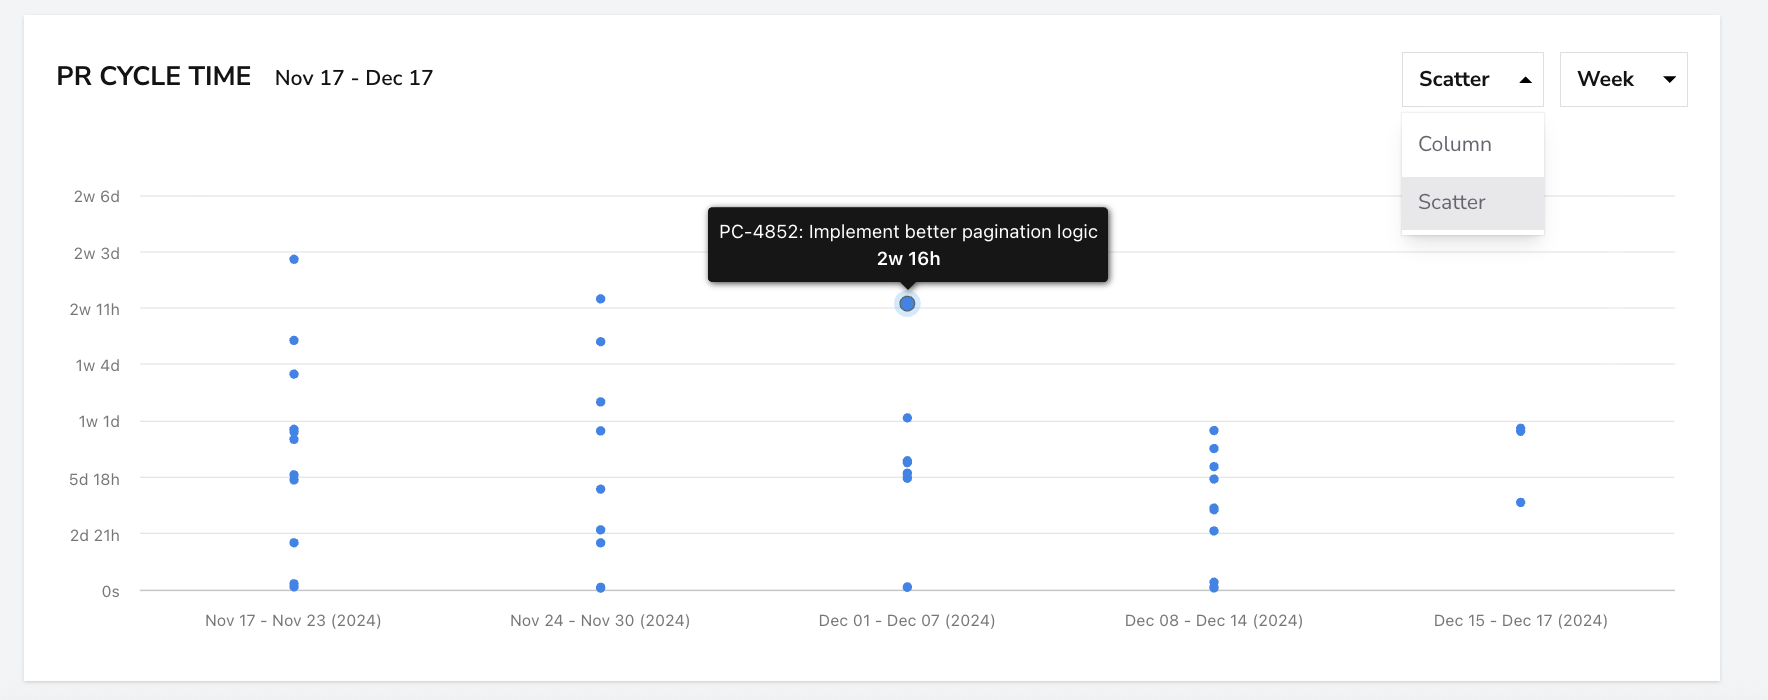
This helps quickly identify outliers, such as PRs that took significantly longer to complete, and discuss them with your team to analyze patterns or underlying causes.
Example: Analyzing PR Cycle Time
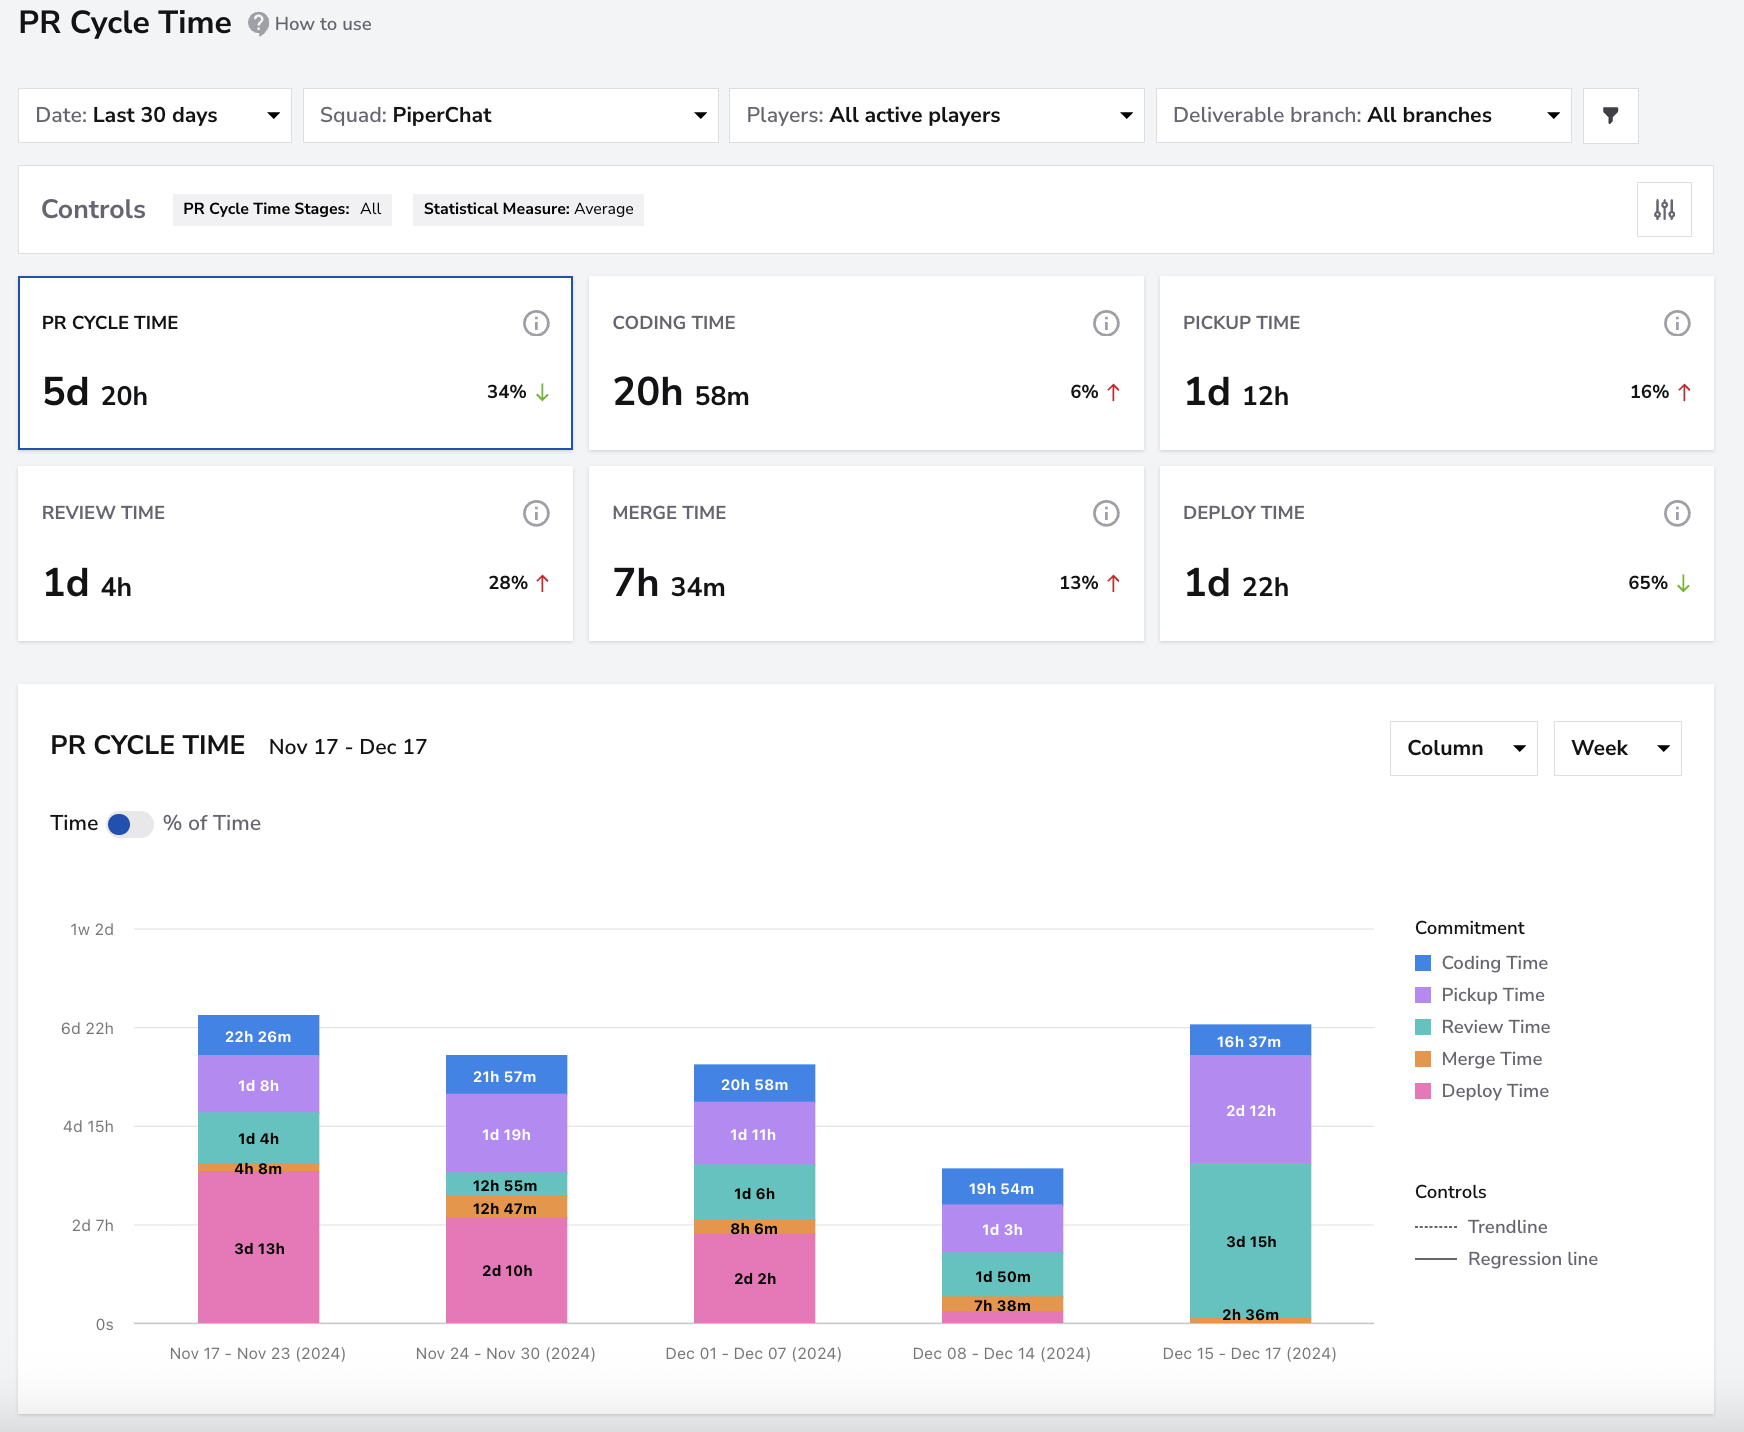
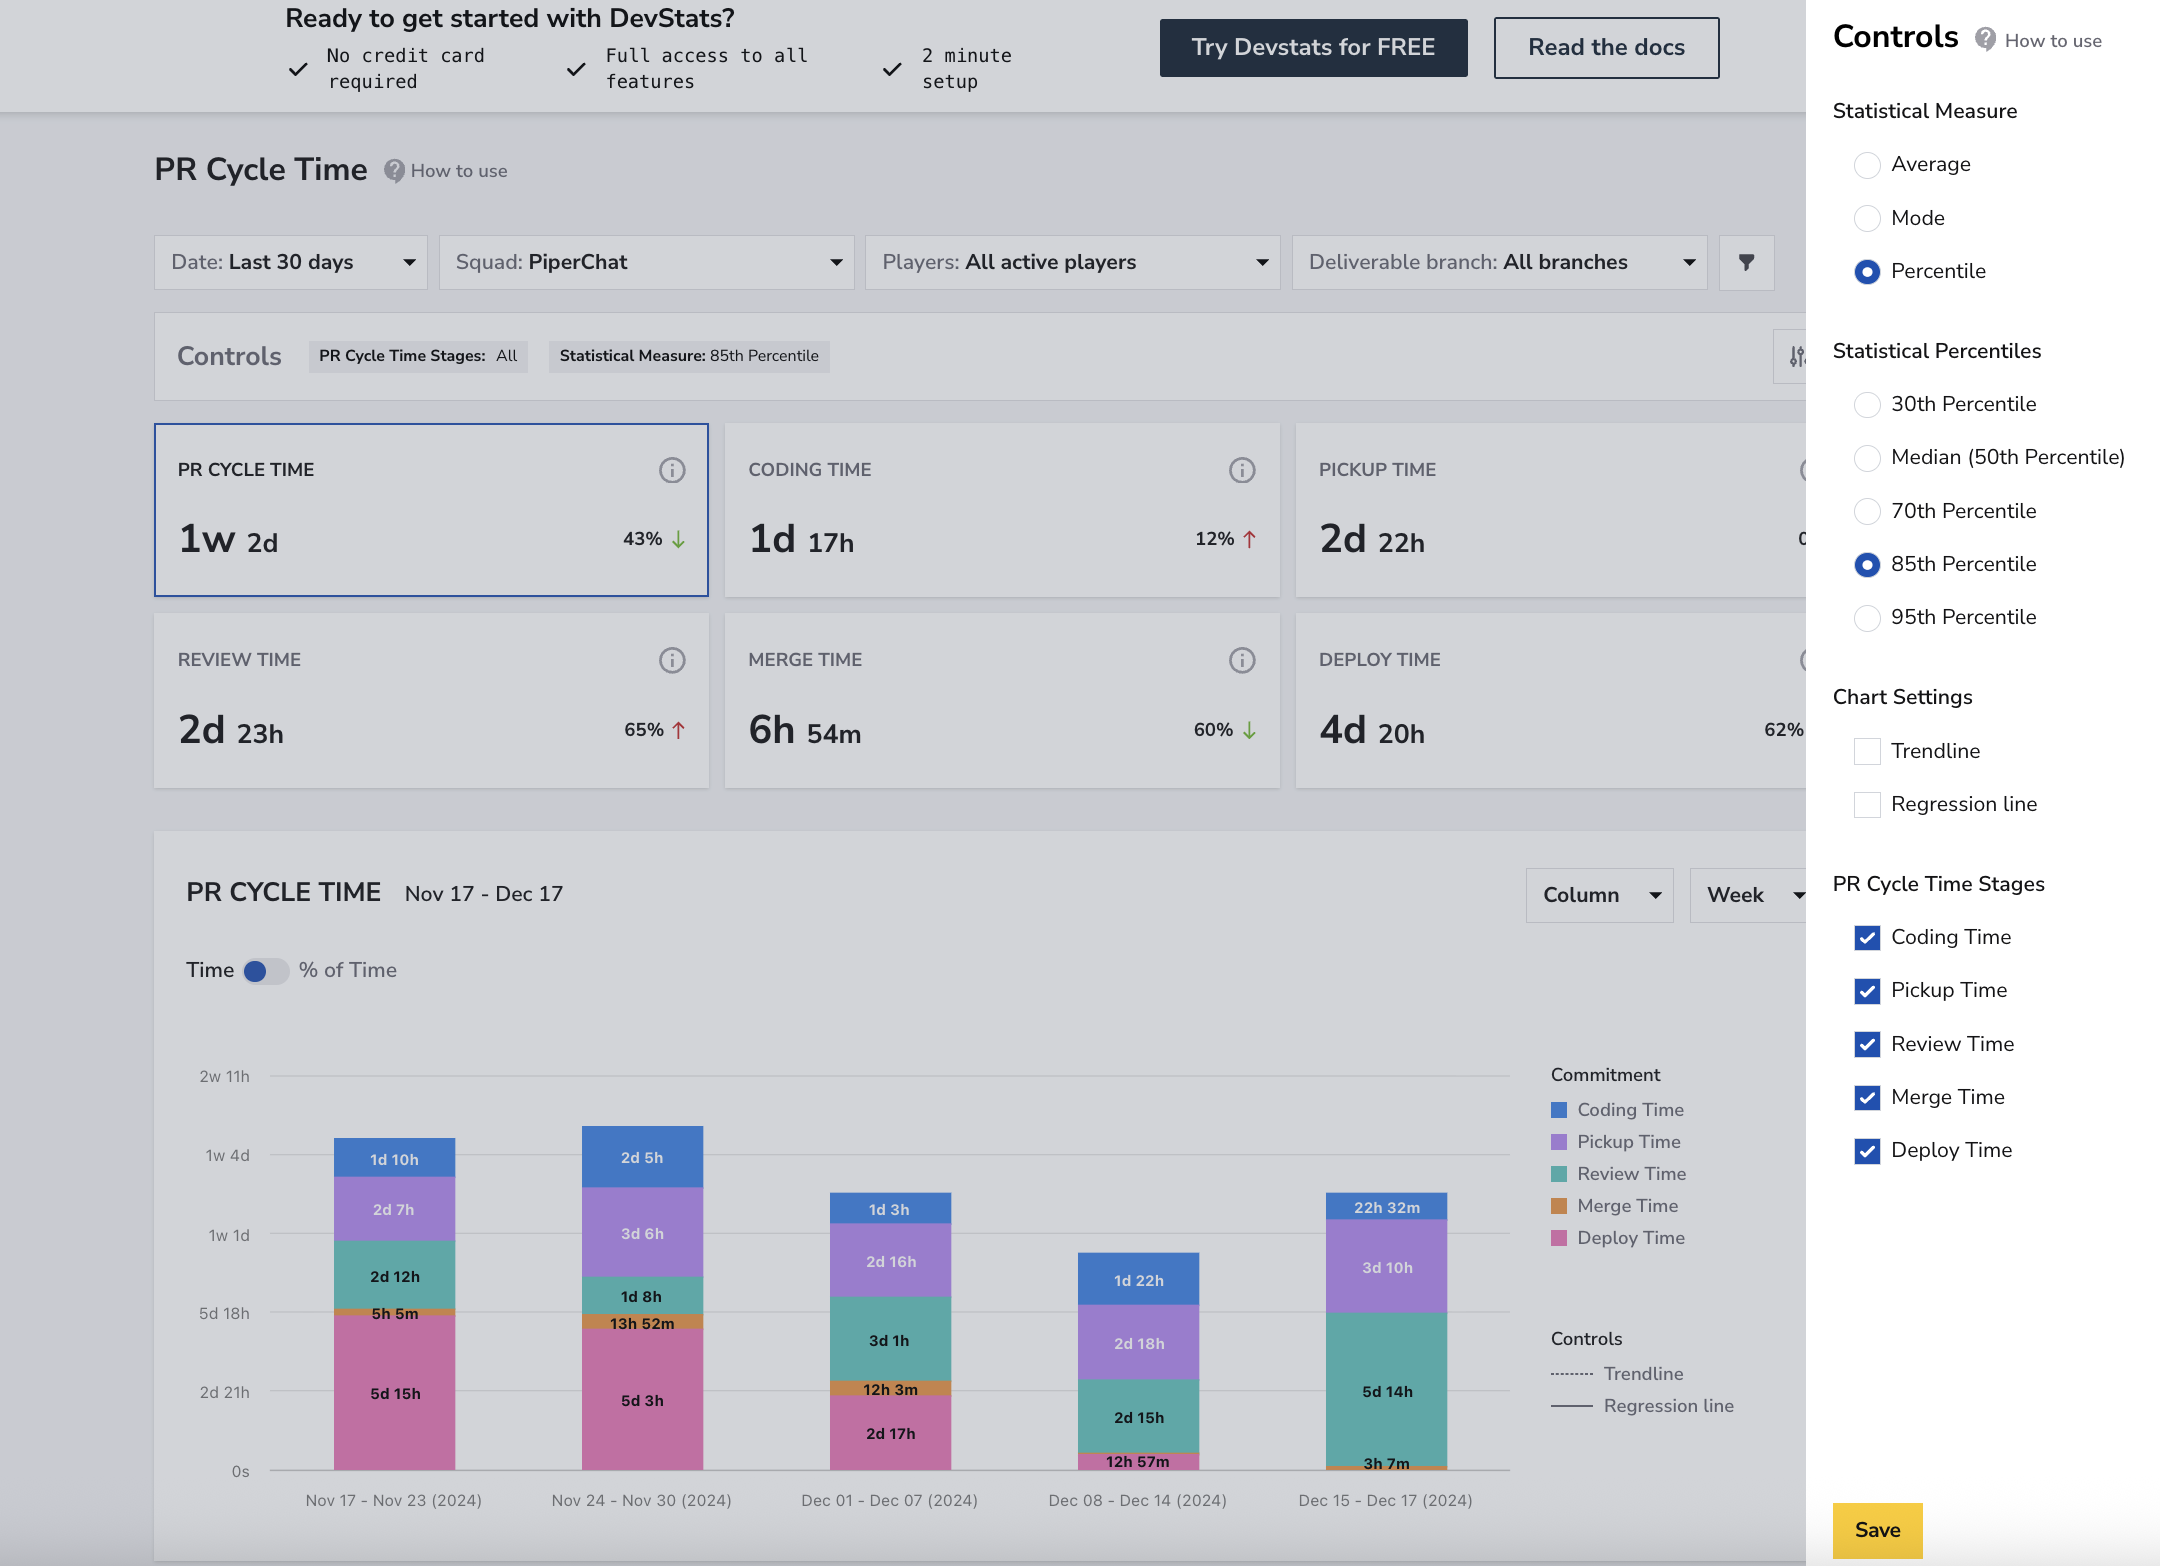
In the example below, we’re looking at the PiperChat squadover the last 30 days, with all active players and branches included.
The average PR Cycle Time is 5 days and 20 hours, which means that, on average, it takes just under six days for a pull request to move from creation to deployment.
Stage Breakdown
-
Coding Time (20h 58m) → Time spent writing code before opening a pull request.
-
Pickup Time (1d 12h) → Time between pull request creation and the first review.
-
Review Time (1d 4h) → Duration from the first review to approval or merge.
-
Merge Time (7h 34m) → Time from approval to merging into a branch.
-
Deploy Time (1d 22h) → Time between that first branch and merge into the deployment branch.
The color-coded chart shows how each stage contributes to the total PR Cycle Time across weeks. Here, Review Time increased by 28%, suggesting a bottleneck in the review phase, whileDeploy Time decreased by65%, indicating improvement in release efficiency.
Recommended Configuration
In the PR Cycle Time Dashboard settings, we recommend selecting the 85th percentileas the statistical measure instead of the default average.
The 85th percentile provides a more stable and realistic representation of delivery time, filtering out outliers from unusually long or short pull requests. This approach helps teams set expectations based on consistent performance rather than exceptional cases.
You can adjust this setting in the Controls panel: Open the panel → under Statistical Measure, select Percentile (85th). This configuration aligns your PR metrics with DORA best practices, giving a clearer understanding of typical delivery performance and reducing noise in long-term trend analysis.
Diagnosing Bottlenecks
Cycle Time trends often reveal process inefficiencies. In this example:
- The Review stage is consistently the slowest, suggesting delayed feedback or reviewer overload.
- Coding and Merge times remain stable, indicating that development pace and merging workflows are healthy.
- Deploy Time dropped sharply, showing that improvements in automation or CI/CD have accelerated releases.
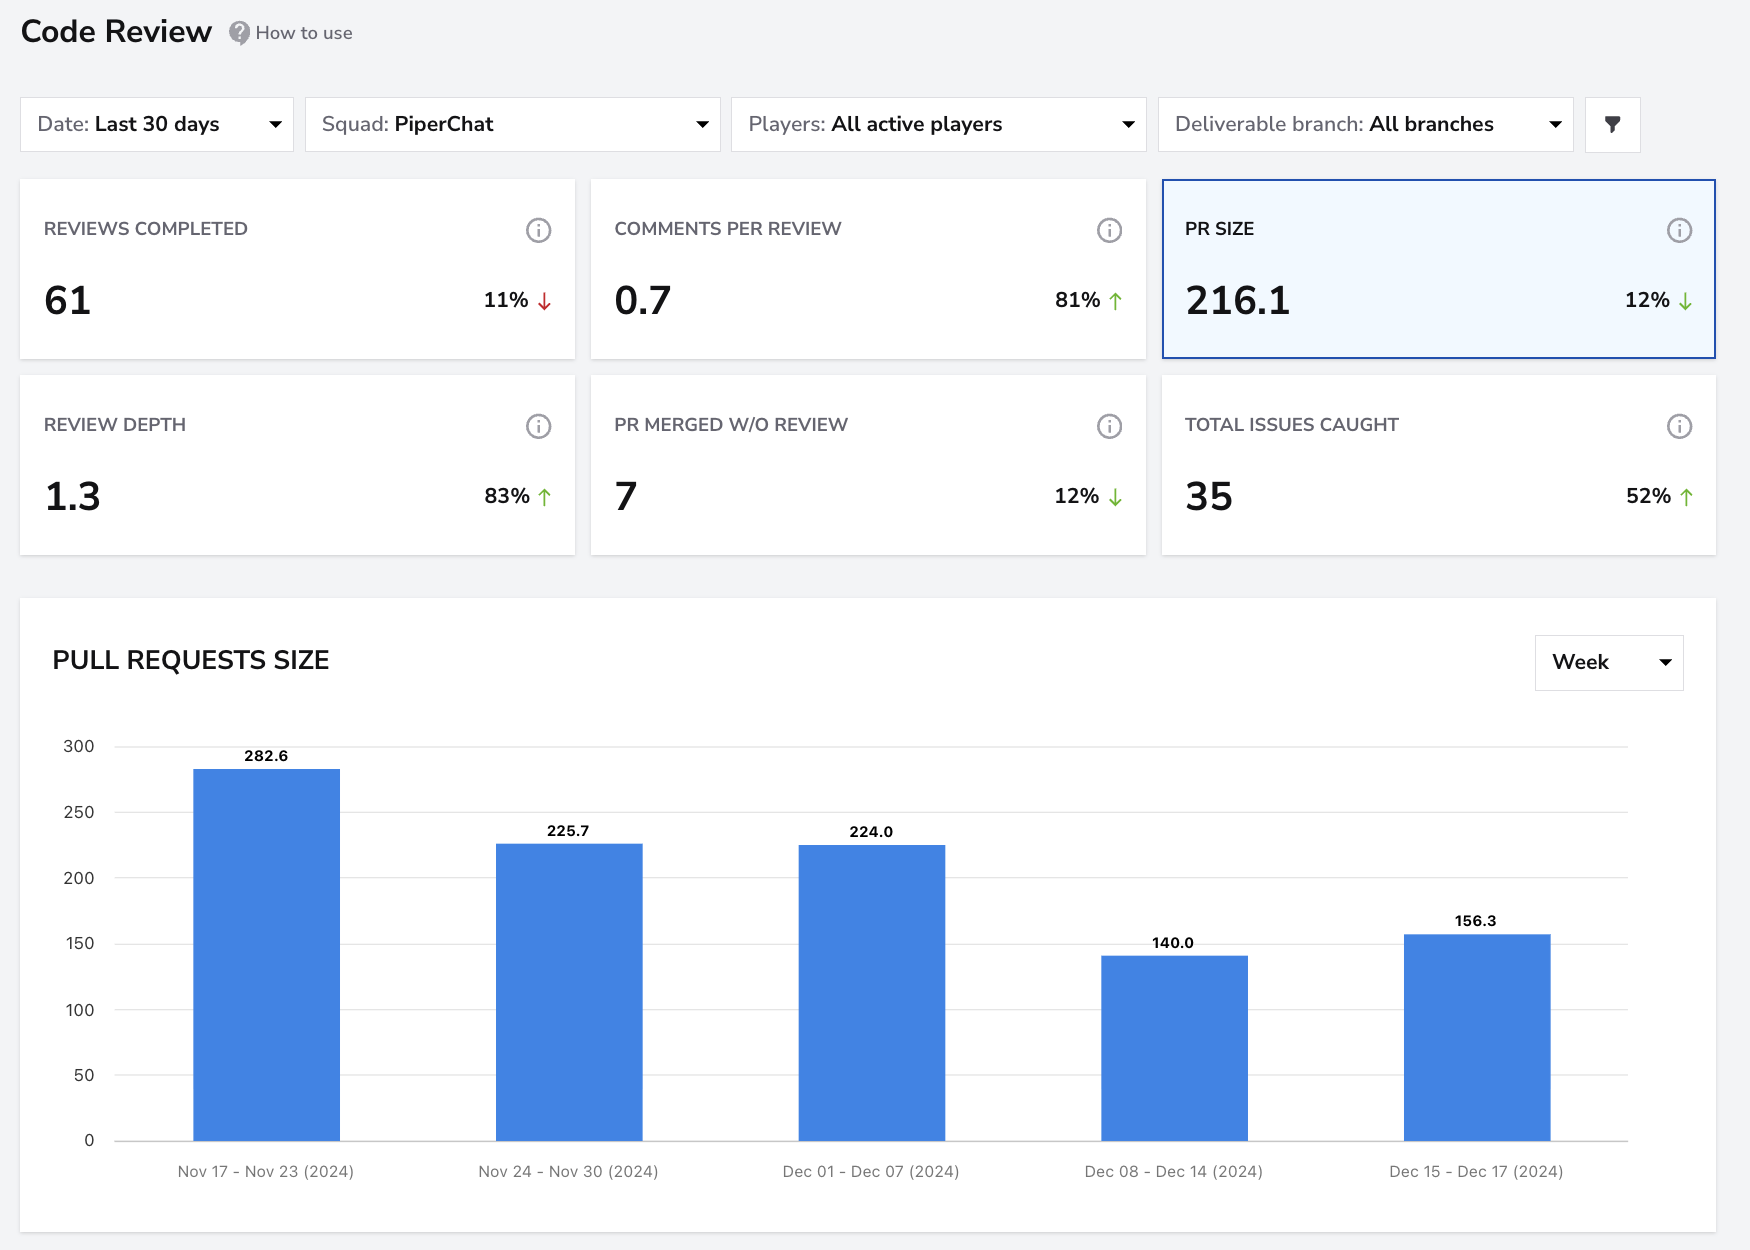
To further optimize your flow, review PR Size in the Code Review Dashboard. Smaller pull requests are easier to review, reduce cognitive load, and move through the pipeline faster. Since the review phase is often the most common bottleneck, keeping PRs small and focused helps improve both speed and quality of delivery.
You can also use the Aging Branches Report to monitor in-progress work and prevent bottlenecks before they happen.
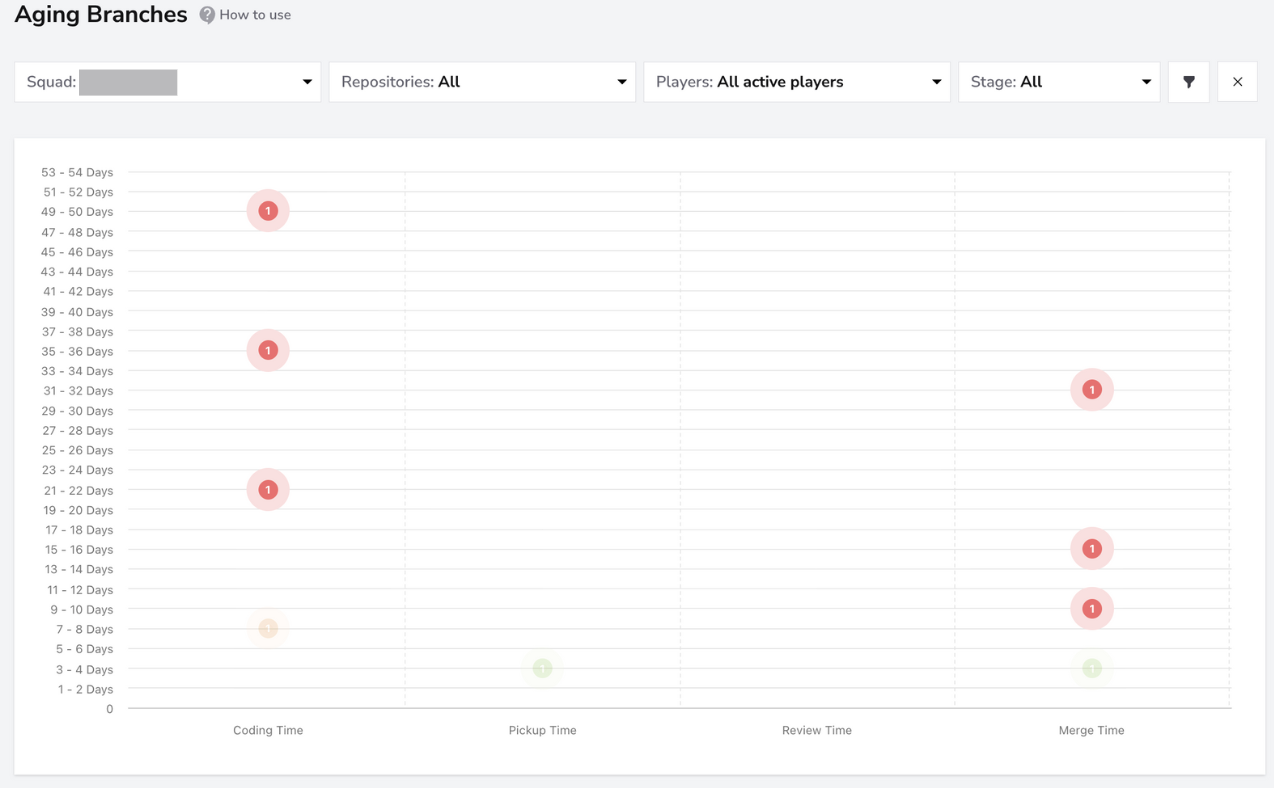
Each dot represents an open branch — its position shows the current stage (e.g., Coding, Review, Merge), while color intensity indicates how long it has stayed there. By clicking on a circle, you can view detailed branch information, including how many days it has been open and which stage it’s currently in.
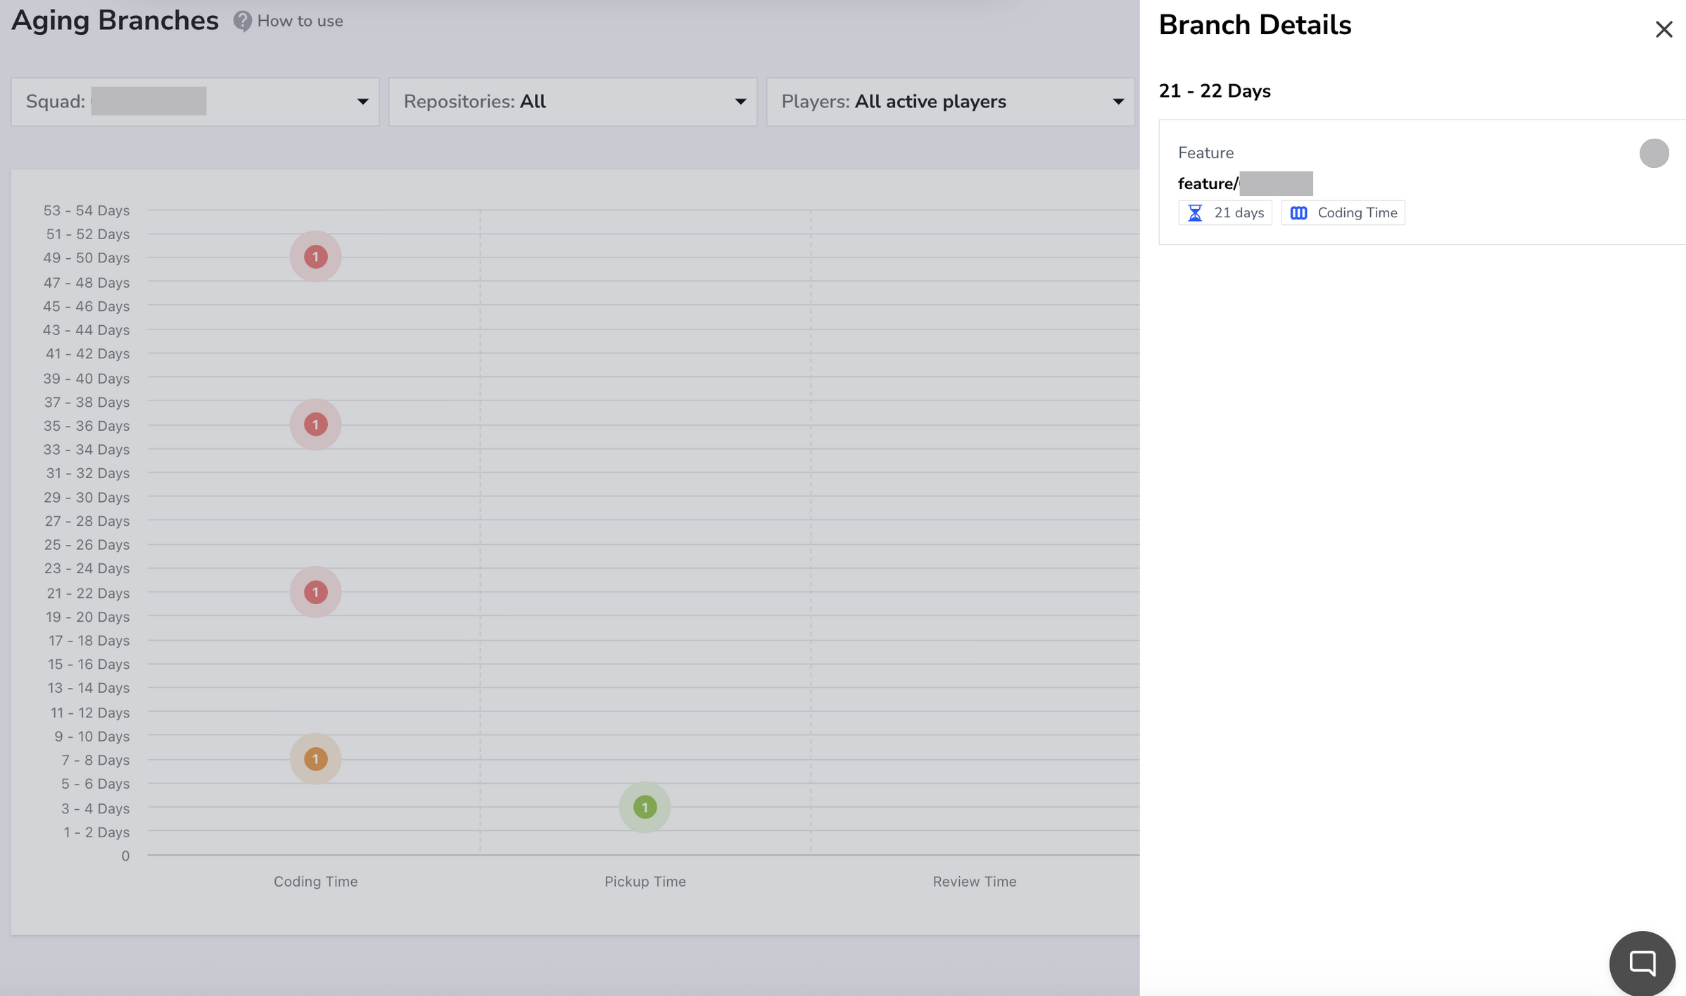
This real-time visibility allows teams to prioritize reviews and merges for older branches, ensuring a balanced and predictable delivery flow.
You can also visit the Benchmarks view under the Snapshot section to compare your PR Cycle Time with industry standards.
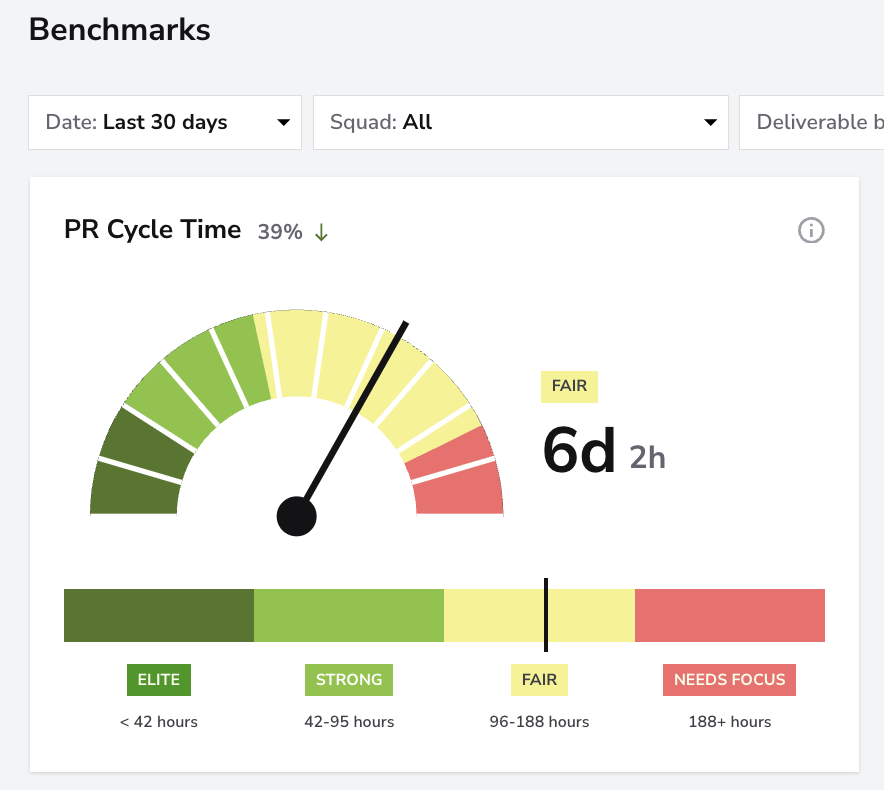
This helps contextualize your team’s performance level, from Elite (<42 hours) to Needs Focus (>188 hours), and identify realistic improvement targets based on global engineering benchmarks.
Taking Action
DevStats helps you transform metrics into improvement actions:
- Use the PR Cycle Time Dashboard in retrospectives to identify slow stages.
- Review the Aging Branches Report daily to keep the flow healthy.
- Set clear review and merge targets for your team (e.g., “Review within 24h, Merge within 2 days”).
- Combine insights with DORA metrics to connect PR flow improvements with real delivery performance.
Continuous visibility enables faster decisions, fewer delays, and a smoother path from code to production.