Overview
Squads often juggle multiple streams of work, such as product features, technical debt, refactors, incidents and experiments, all competing for attention. Without visibility into where time is actually going, focus is easily lost.
Common patterns include:
- Too many tasks in progress at once
- Context switching between unrelated initiatives
- Finishing most of a project but rarely closing it
When these patterns become the norm, delivery slows down, priorities blur and the squad loses sight of outcomes. A focused squad finishes what it starts, delivers value in smaller increments and learns faster from each iteration.
By analyzing DevStats reports like Issue Cycle Time,Engineering Investment and Planning Accuracy, squads can gain clarity on where their time goes, make data-driven decisions and strengthen their ability to deliver consistently.
Prerequisites & Setup
To get started, make sure your squad has the following connections configured:
- Git provider connected
- Issue tracker connected
Once these integrations are active, DevStats automatically calculates metrics such as Cycle Time,Planning Accuracy,Engineering Investment and Work Breakdown, allowing your squad to track focus and flow in real time.
Using DevStats
To evaluate how focused your squad is, start from the following reports:
1. Understand your Flow with Issue Cycle Time
The Issue Cycle Time chart shows how long it takes for work to move from start to completion, divided into stages such as In Progress, Code Review, QA and Changes Requested. These stages reflect the columns in your issue tracker that represent active workflow states, like statuses containing “In”, “Review” or “QA”.
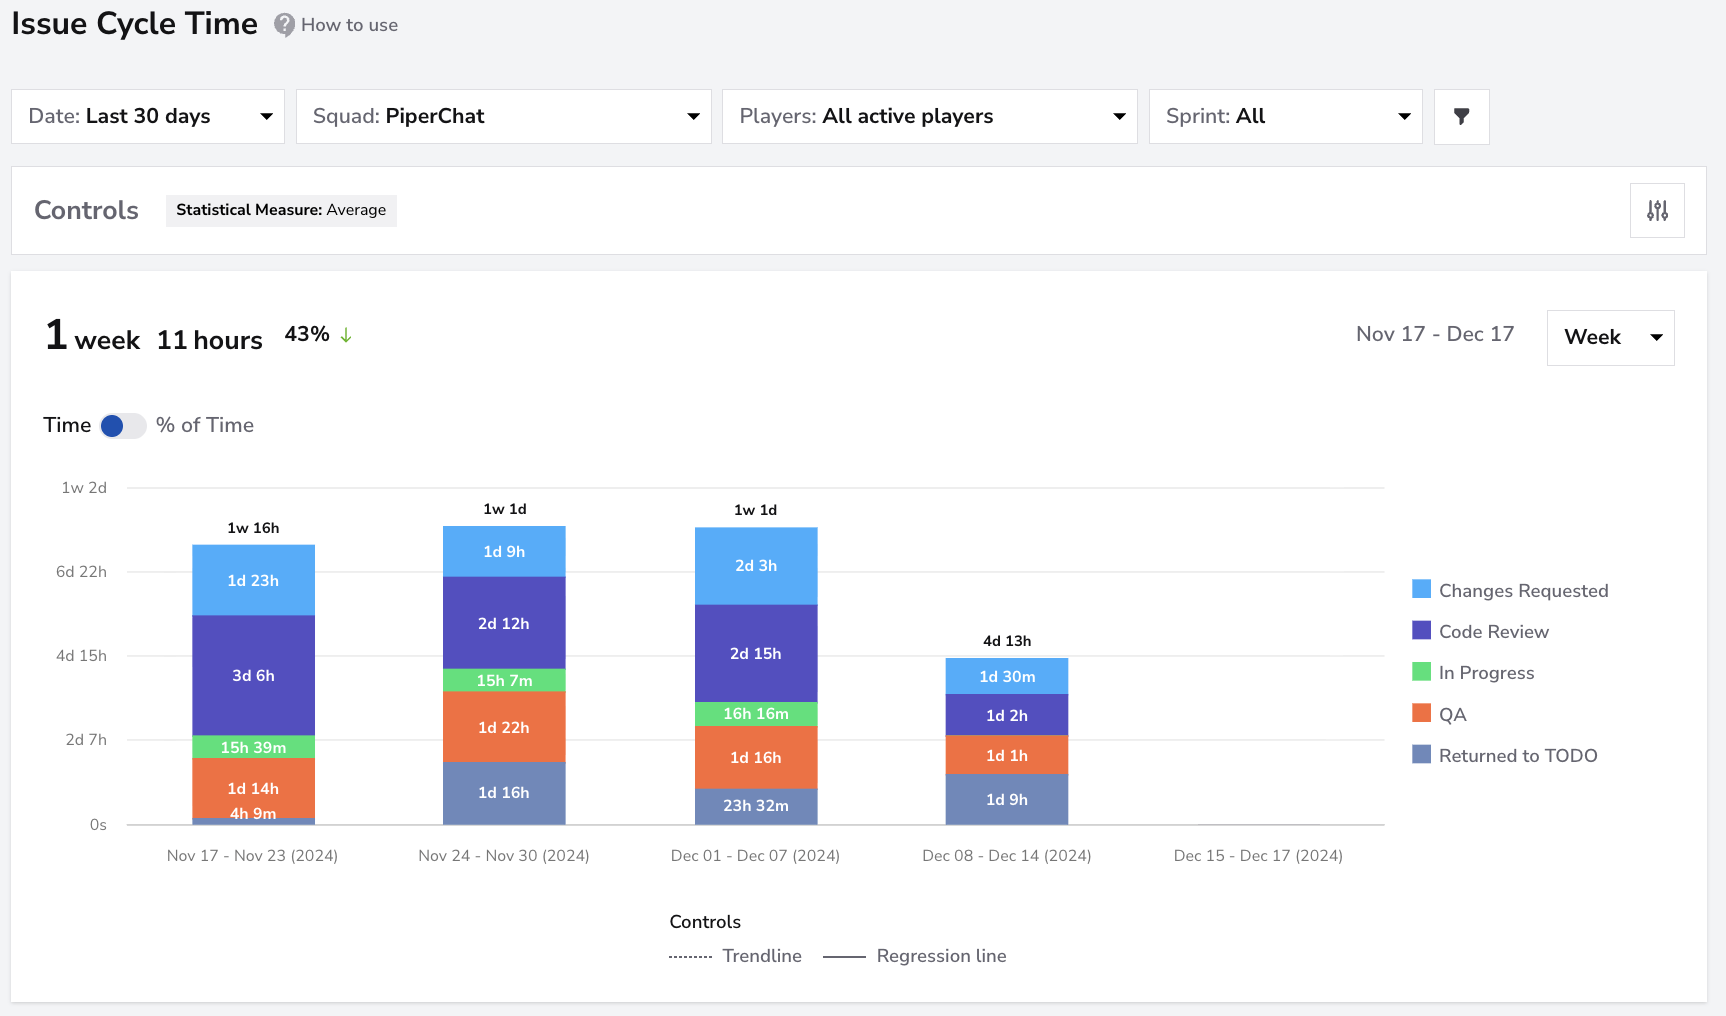
This view helps squads identify where work slows down or frequently loops back.
Use it to spot:
- Long review stages: Pull requests may be waiting too long for feedback or approvals.
- Frequent “Returned to TODO”: Items that move backward often indicate unclear requirements or shifting priorities.
- Stable weekly cadence: A consistent cycle time across weeks is a sign of healthy, continuous delivery flow.
A shorter and more predictable cycle time means your squad is learning faster and delivering value more often.
It is common for squads to have a stage where tasks consistently accumulate more time. One of the most revealing examples is the “Returned to TODO” column, created by DevStats to highlight when items previously In Progress are sent back to an earlier state. This often signals misalignment in scope, blockers discovered late or rework caused by unclear acceptance criteria.
By tracking how often and for how long issues are returned to earlier stages, squads can uncover process gaps such as incomplete grooming, missing context during development or overly strict review gates, and take action to reduce friction in their flow.
2. Spot balance and focus with Engineering Investment
The Engineering Investment view helps squads understand how their time is distributed across different types of work. It shows how much effort goes into building new features, improving existing ones, maintaining systems, and internal productivity.
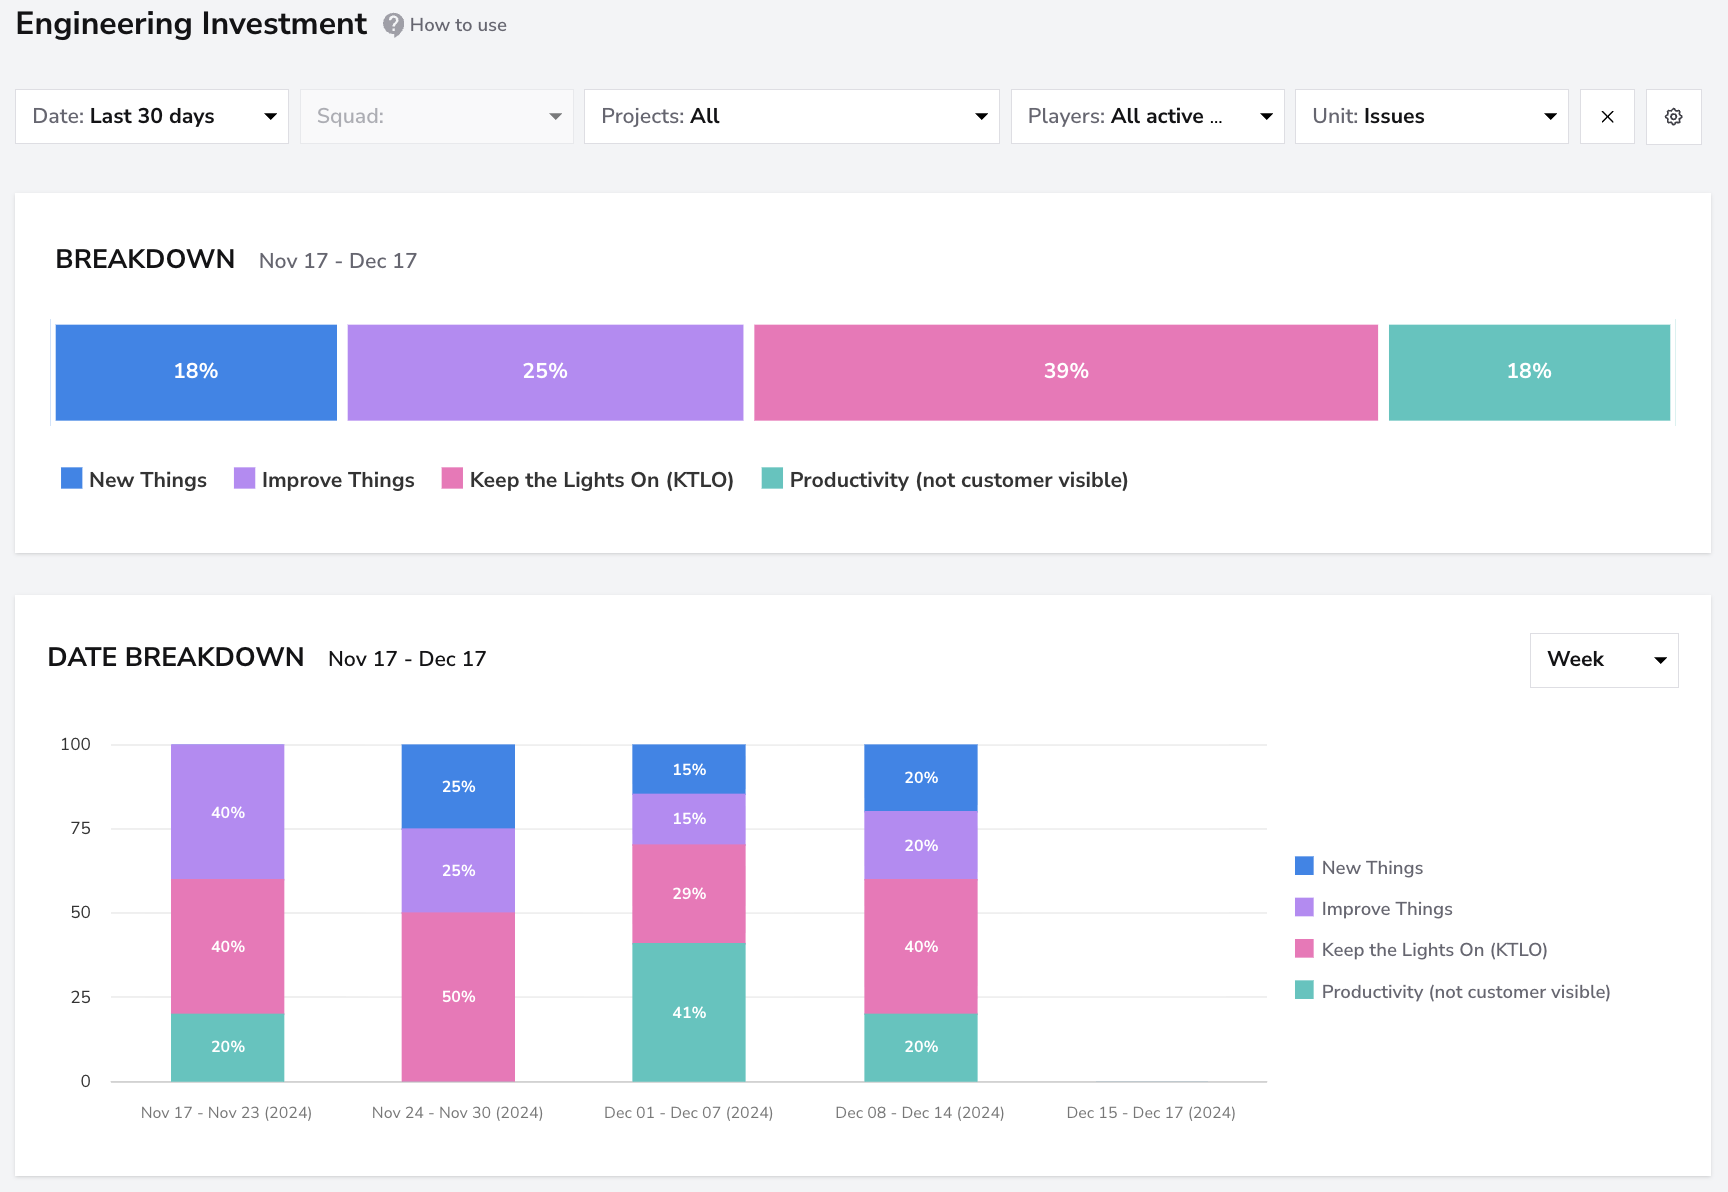
Use it to spot:
- Overloaded maintenance (KTLO): If a large share of time goes into bug fixes or operational work, innovation may be slowing down.
- Low improvement or productivity work: May indicate limited focus on refactors, tooling or scalability
- Unbalanced investments between weeks: May reflect shifting priorities or lack of planning consistency.
A practical reference is the 60-20-20 Rule, which recommends allocating roughly 60% of capacity to new features, 20% to improvements and 20% to productivity and scaling. Keeping KTLO low helps free up time for innovation and long-term value delivery.
3. Evaluate delivery predictability with Planning Accuracy
Planning Accuracy measures how much of the committed work your squad actually delivered in past sprints. It helps assess how realistic your planning and execution are over time.
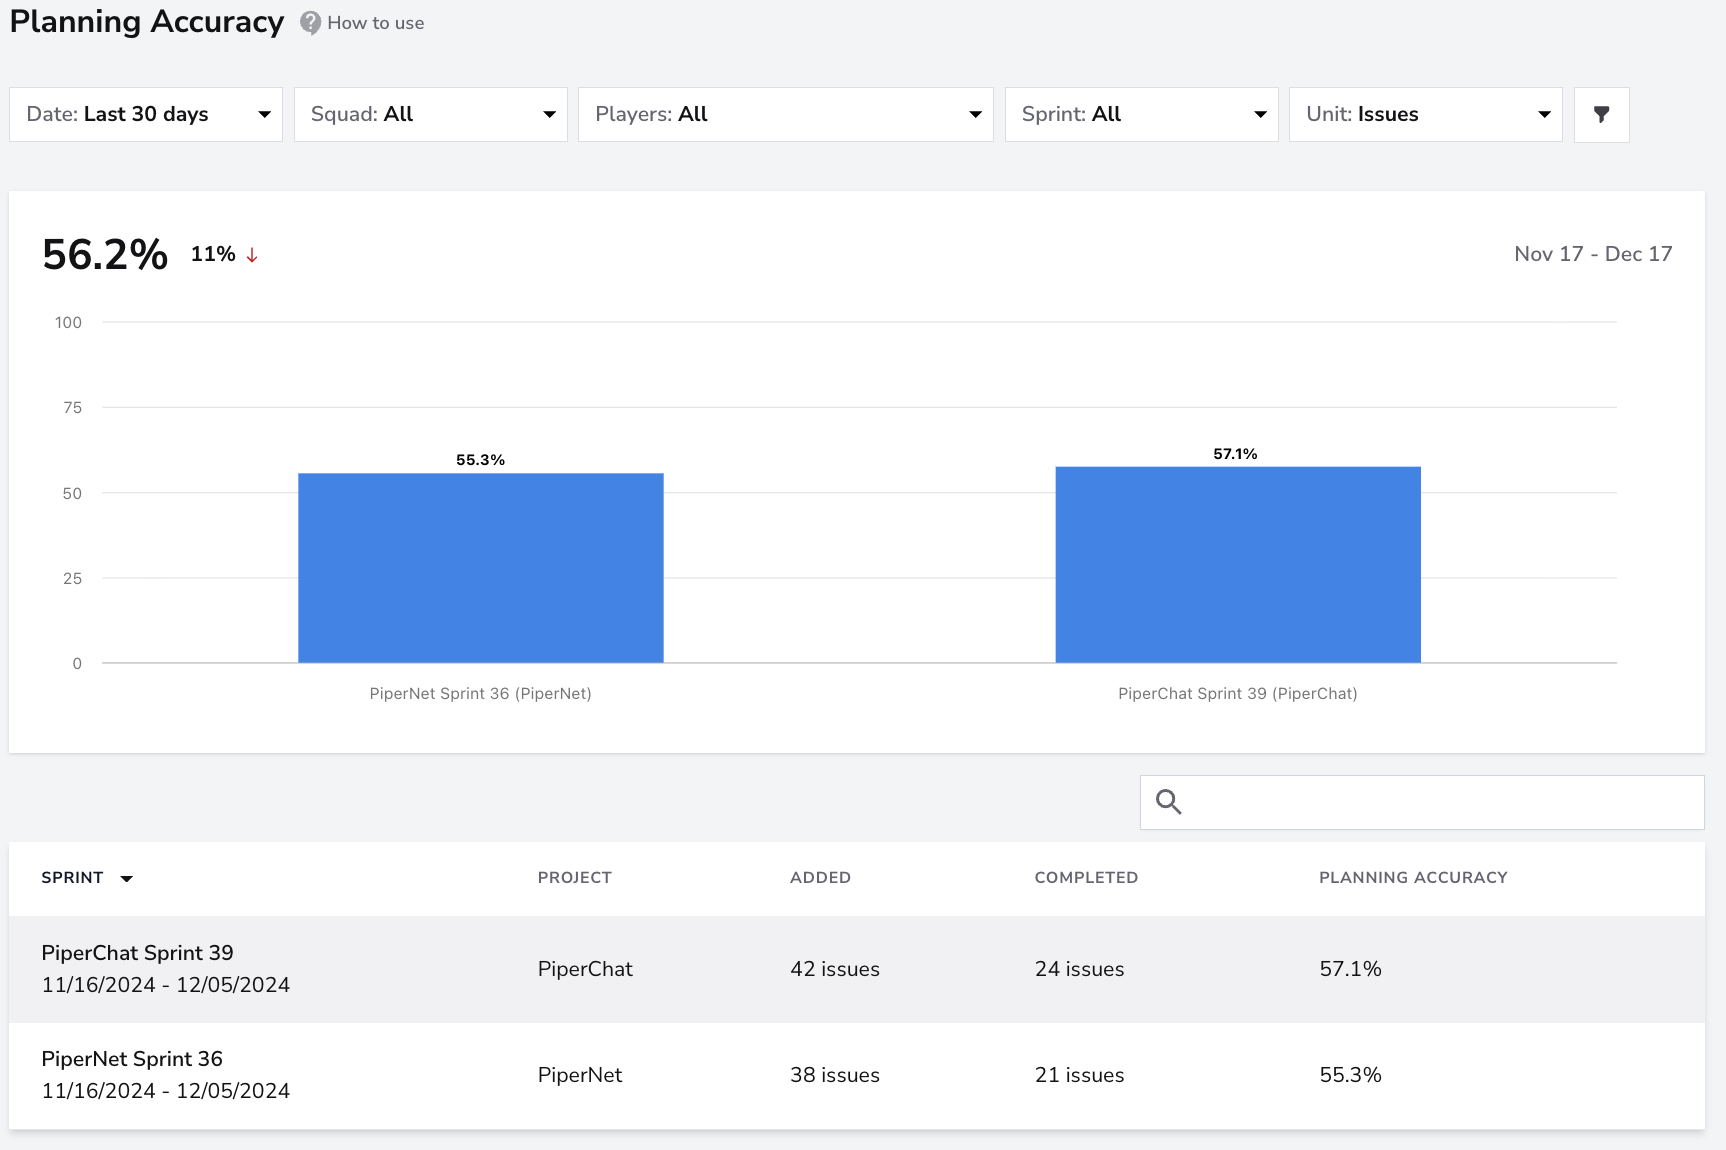
Use it to identify:
- Sudden drops in accuracy (e.g., 57%) which may indicate overcommitment, unplanned work entering mid-sprint, or dependencies and blockers between squads.
- Consistently high scores (near 100%) which could mean the squad is undercommitting and not challenging its capacity.
This metric is especially valuable in retrospectives to recalibrate sprint scope, reduce interruptions, and strengthen predictability. For deeper insights, check the Planning Accuracy Guide to learn how to improve planning and balance commitment with delivery capacity.
4. Identify rework patterns with Work Breakdown
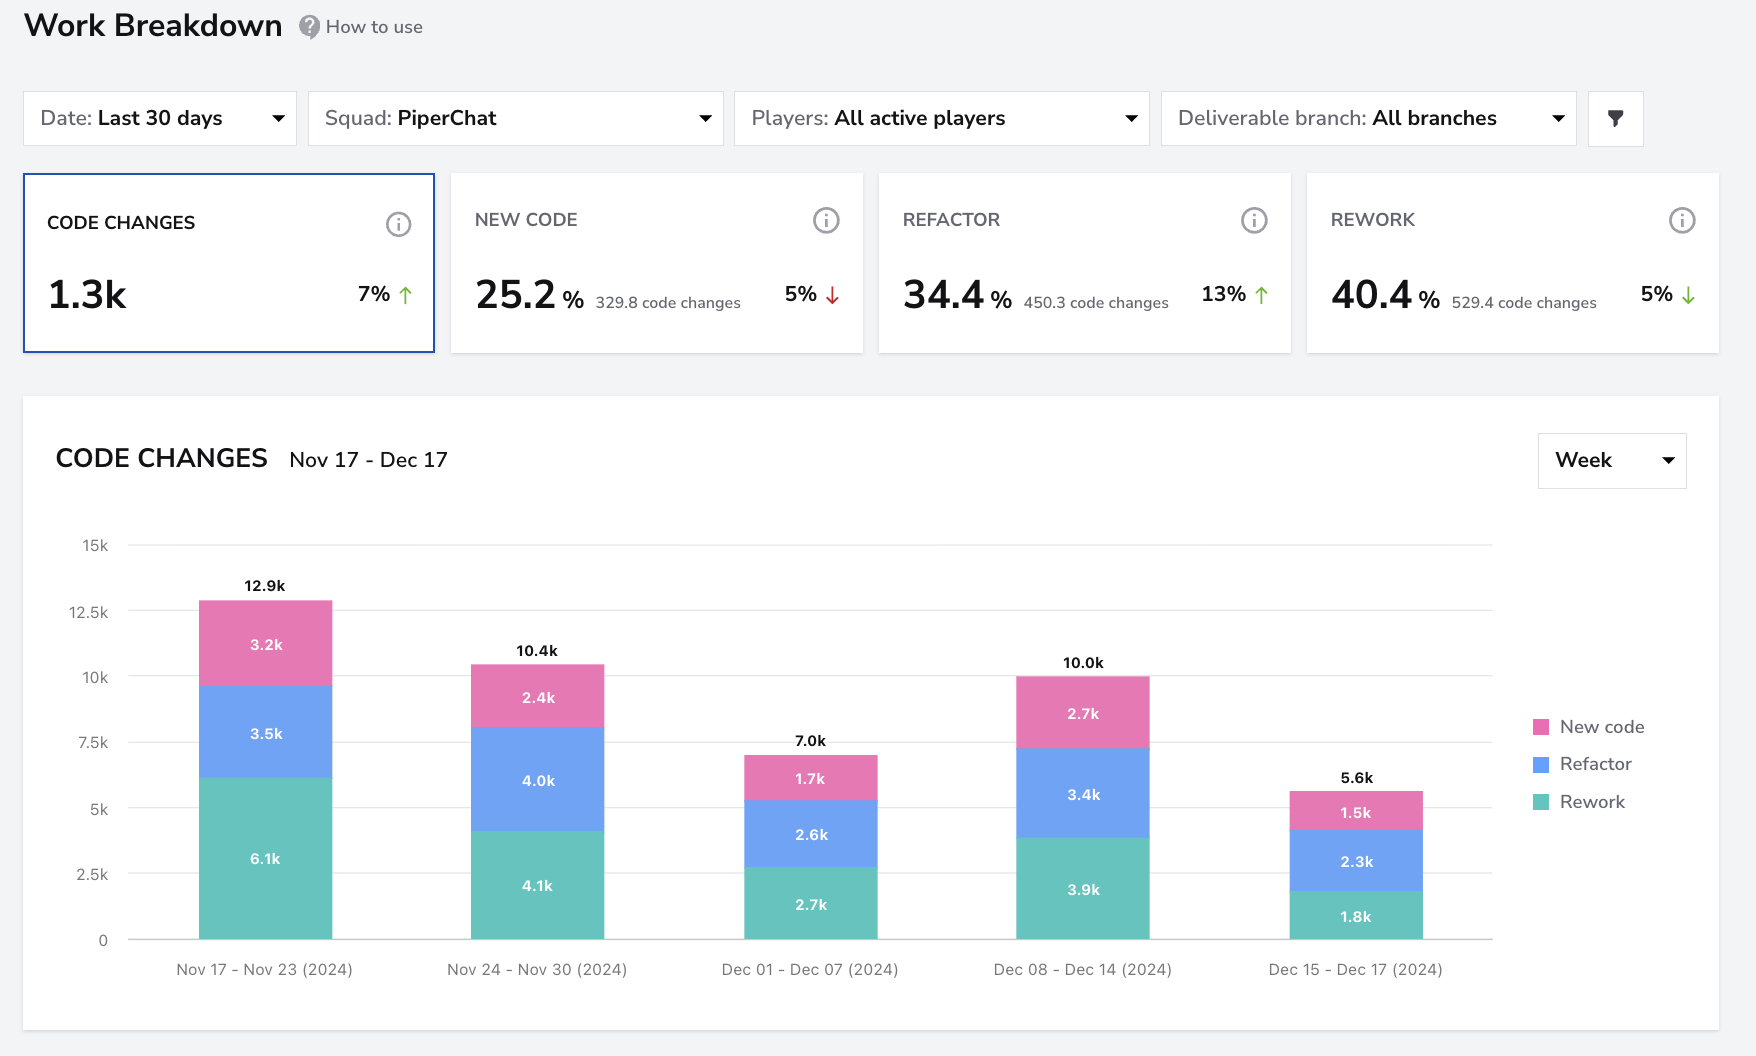
This report breaks down all code changes into:
- New Code: Product increments and new features
- Refactor: Improvements to existing code that has been in the codebase for more than 21 days
- Rework: Revisions or fixes to previously merged work older than 21 days
High Rework or Refactor percentages can suggest unclear requirements or lack of shared code ownership. A healthy flow usually shows consistent New Code output balanced with moderate Refactor activity.
For more detail, see How-To: Detect Patterns in Development Time.
5. Review past sprints with the Sprints view
The Sprints view aggregates data from multiple sprints to reveal long-term trends in planning and execution. It includes metrics such as Added Late Work, Carryover and Newly Committed items, helping identify recurring bottlenecks.
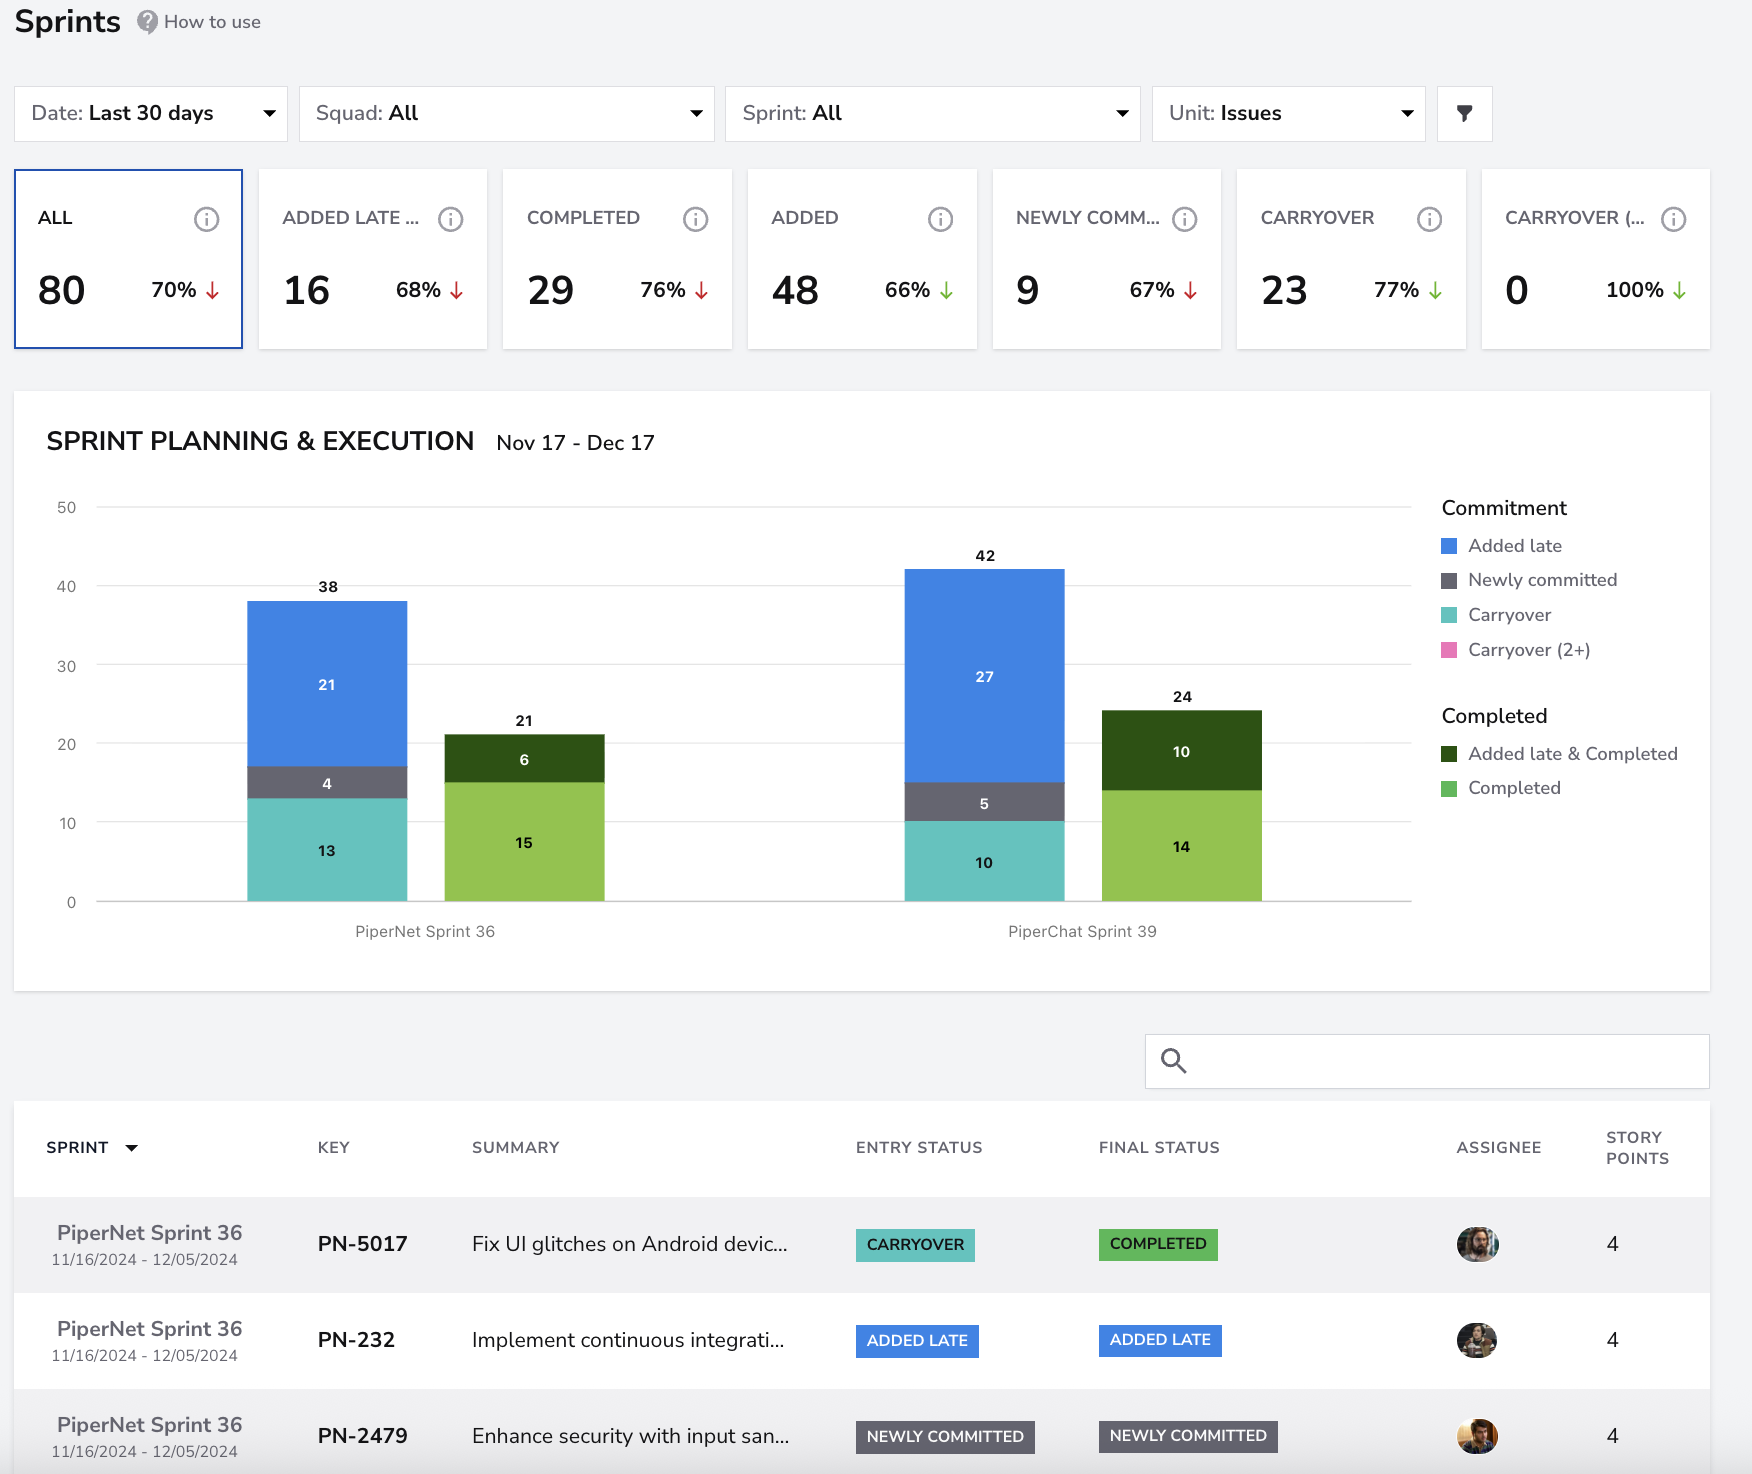
Use it to analyze:
- Carryover patterns: Frequent carryovers may signal overcommitment or dependency delays.
- Added late work: Consistently high numbers show reactive planning or scope creep.
- Completion consistency: Evaluate if sprint outcomes are predictable across time.
Combining these views allows squads to monitor real-time progress while also reflecting on past sprints to improve planning discipline and delivery reliability.
6. Track ongoing sprints with Sprint Progress Summary
The Sprint Progress Summary provides a clear snapshot of how the current sprint is progressing. It combines key metrics like Committed,Added Late,Capacity, and Days Left to help squads monitor sprint health and make informed adjustments.
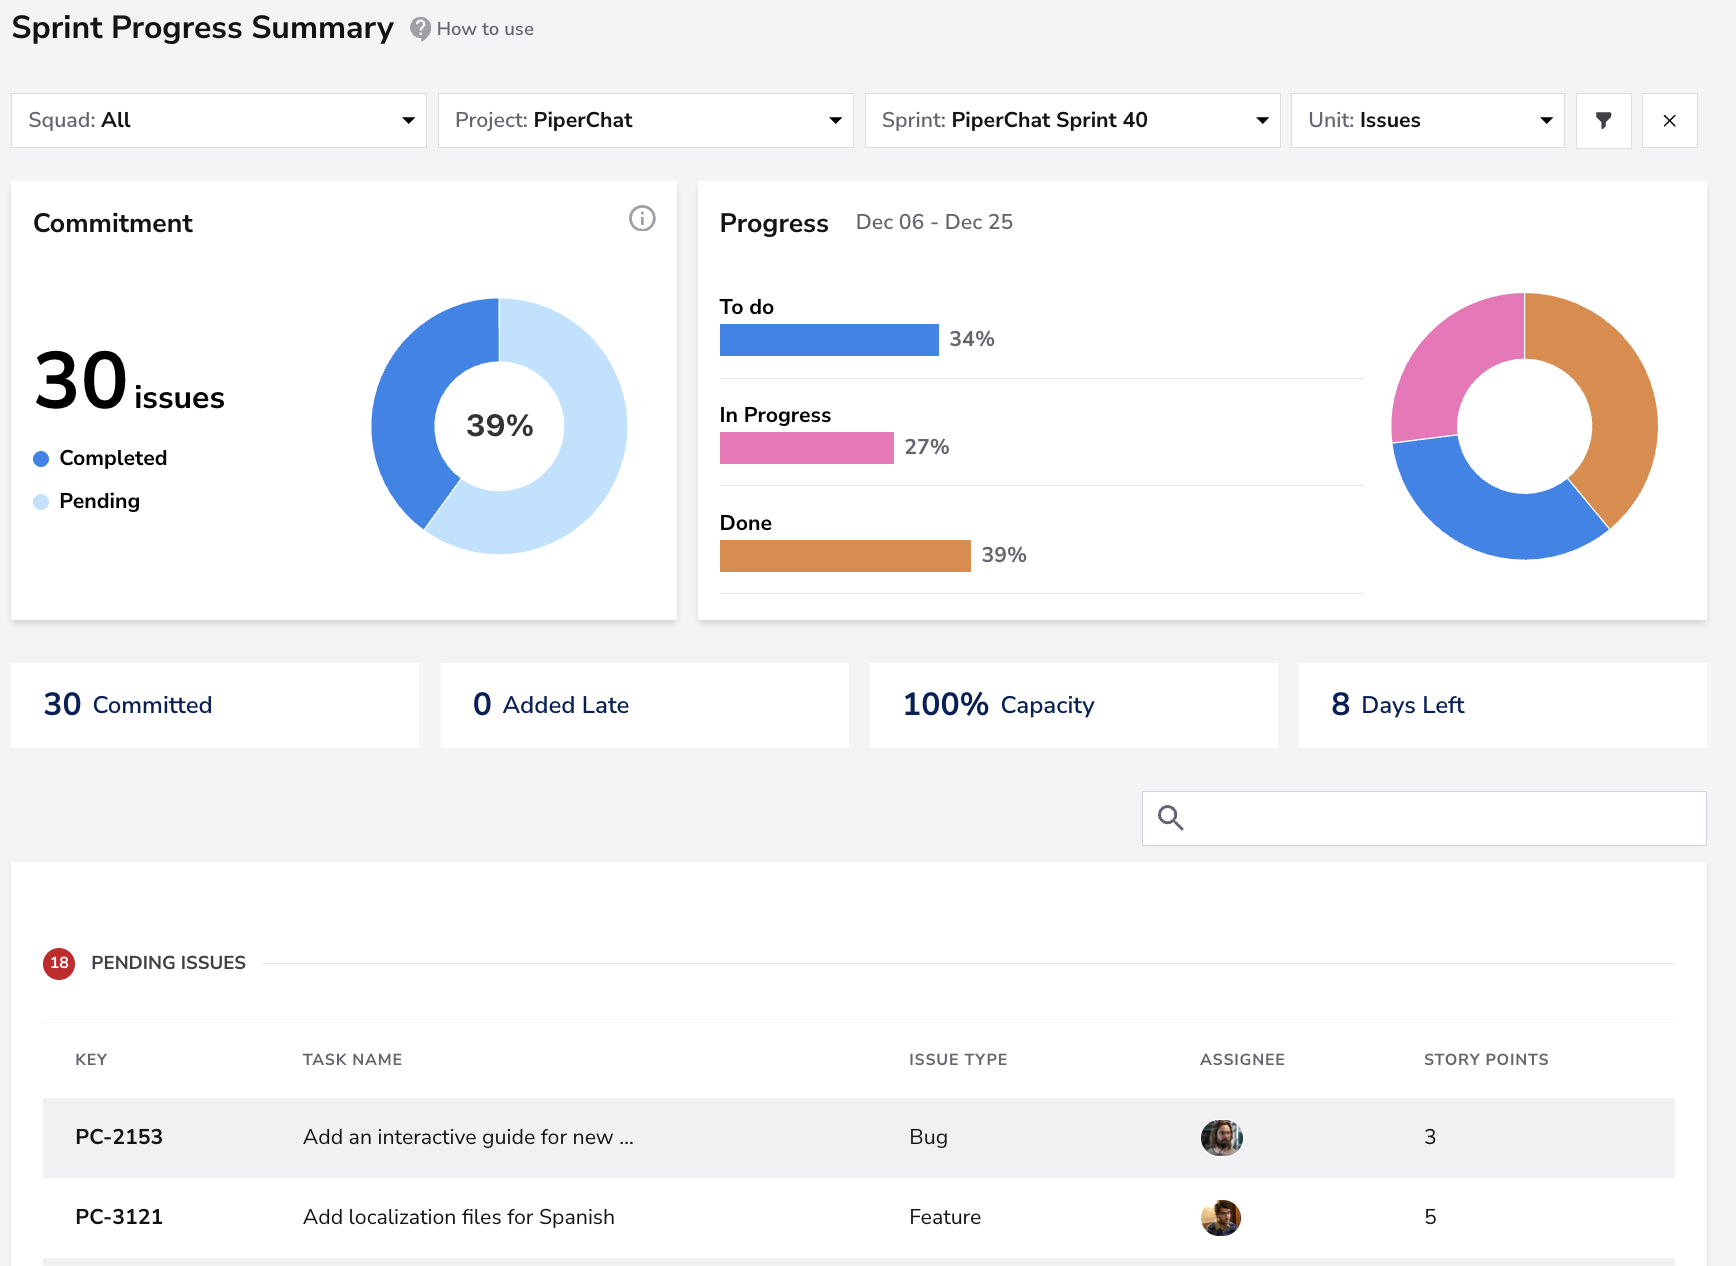
Use it to track:
- Progress status: Understand how much of the committed work has been completed versus what remains.
- Scope changes: Identify tasks added after the sprint started to prevent scope creep.
- Capacity and workload: Compare current commitments with previous sprints to maintain a sustainable pace.
- Focus areas: Spot where most issues are concentrated — To Do, In Progress, or Done.
This report helps squads stay aligned throughout the sprint, ensuring that risks, blockers or imbalances are identified early rather than discovered at the end.
Taking Action
Once patterns are identified, use DevStats insights to drive improvement discussions during retrospectives or syncs. You can:
- Review Cycle Time outliers to understand where work gets stuck.
- Rebalance Engineering Investment if KTLO or Rework grows too much.
- Use Sprint Progress Summary to detect early risks and adjust mid-sprint.
- Track trends across sprints to ensure delivery becomes more predictable over time.
The goal is not only to measure performance but to use the data to prioritize what will help the squad deliver value faster and more consistently.
Rollout Strategy
- Start small: Select one or two squads for a pilot and verify integrations and data accuracy.
- Review together: Explore dashboards like Cycle Time,Planning Accuracy, and Investment with the squad to surface insights.
- Facilitate learning: Use retrospectives to discuss the causes behind patterns, not just the numbers.
- Scale gradually: Once improvements are visible, use those case studies to expand DevStats usage to more squads.
This approach ensures each squad understands the purpose of the data, builds confidence in the metrics, and uses DevStats as a continuous improvement tool, not just a reporting dashboard.