Overview
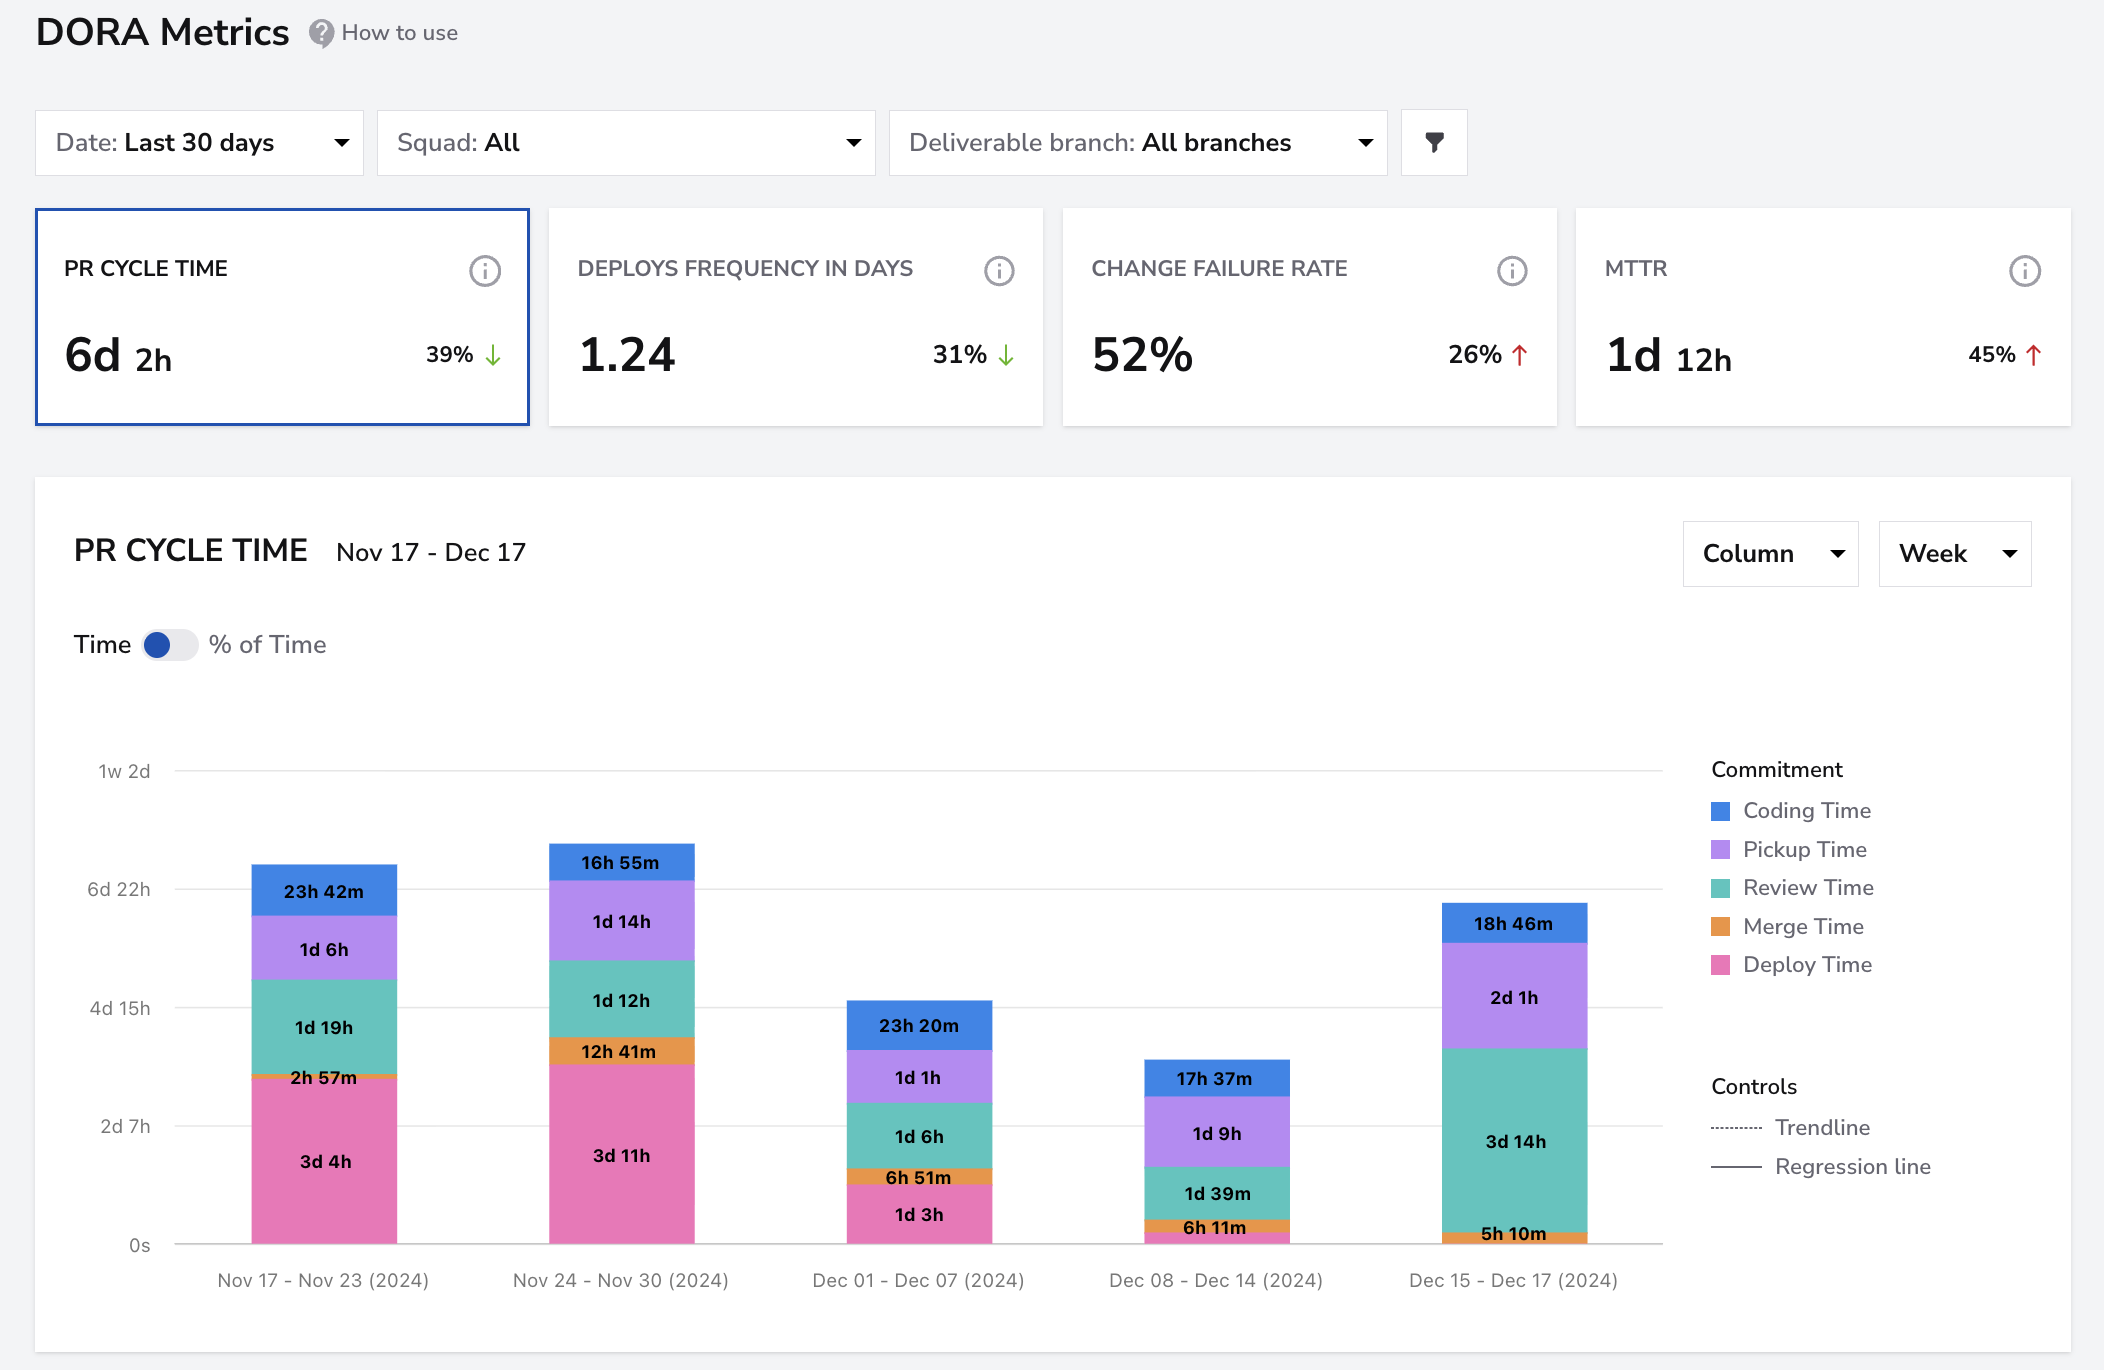
DORA metrics come from the DevOps Research and Assessment program, a research initiative backed by Google that has studied more than 30,000 engineering teams worldwide. The framework identifies four key indicators that reliably describe software delivery performance: how fast teams ship and how stable their releases are.
You can learn more about the official research at https://dora.dev/.
Most companies want to adopt DORA, but few manage to implement it consistently because the setup usually requires manual tracking, custom scripts or fragmented data sources. DevStats solves this by giving you all four DORA metrics out of the box.
And the best part is that you don’t need to set anything up to start tracking DORA metrics.
DevStats works plug-and-play: incidents are identified by default using branch prefixes such as hotfix or bugfix. Configuration is optional and only needed if you want more precisionor custom rules.
Getting Started
Step 1: Configure How DevStats Detects Incidents
DevStats offers three simple ways to track incidents. Choose the option that best fits your workflow:
Option A: Git Prefix (default)
DevStats automatically detects incidents using branch prefixes such as hotfix or bugfix.
Option B: Manual Incident Management Create and resolve incidents directly in DevStats using the built-in Incident Management page.
Option C: Incidents API If your team already uses an external incident tool or automation, send incident start and end events to DevStats through the API.
This setting directly impacts Change Failure Rate and Mean Time to Restore (MTTR).
Step 2: Configure How Deploys Are Detected
Make sure each repository has the correct deployment branch selected (for example, main, master, or production).
You have two options:
Git Provider (default) DevStats detects a deploy when code is merged into the selected deploy branch.
Deploy API For full precision, add a POST request to your CI pipeline to notify DevStats whenever a deploy happens.
Step 3: Confirm Your Setup
Once incidents and deployments are configured, DevStats will automatically calculate:
• Deployment Frequency • Change Failure Rate • Mean Time to Recovery (MTTR)
This ensures your DORA metrics reflect the real delivery performance of your team with the accuracy level you choose.
What You Can Measure
DORA
PR Cycle Time
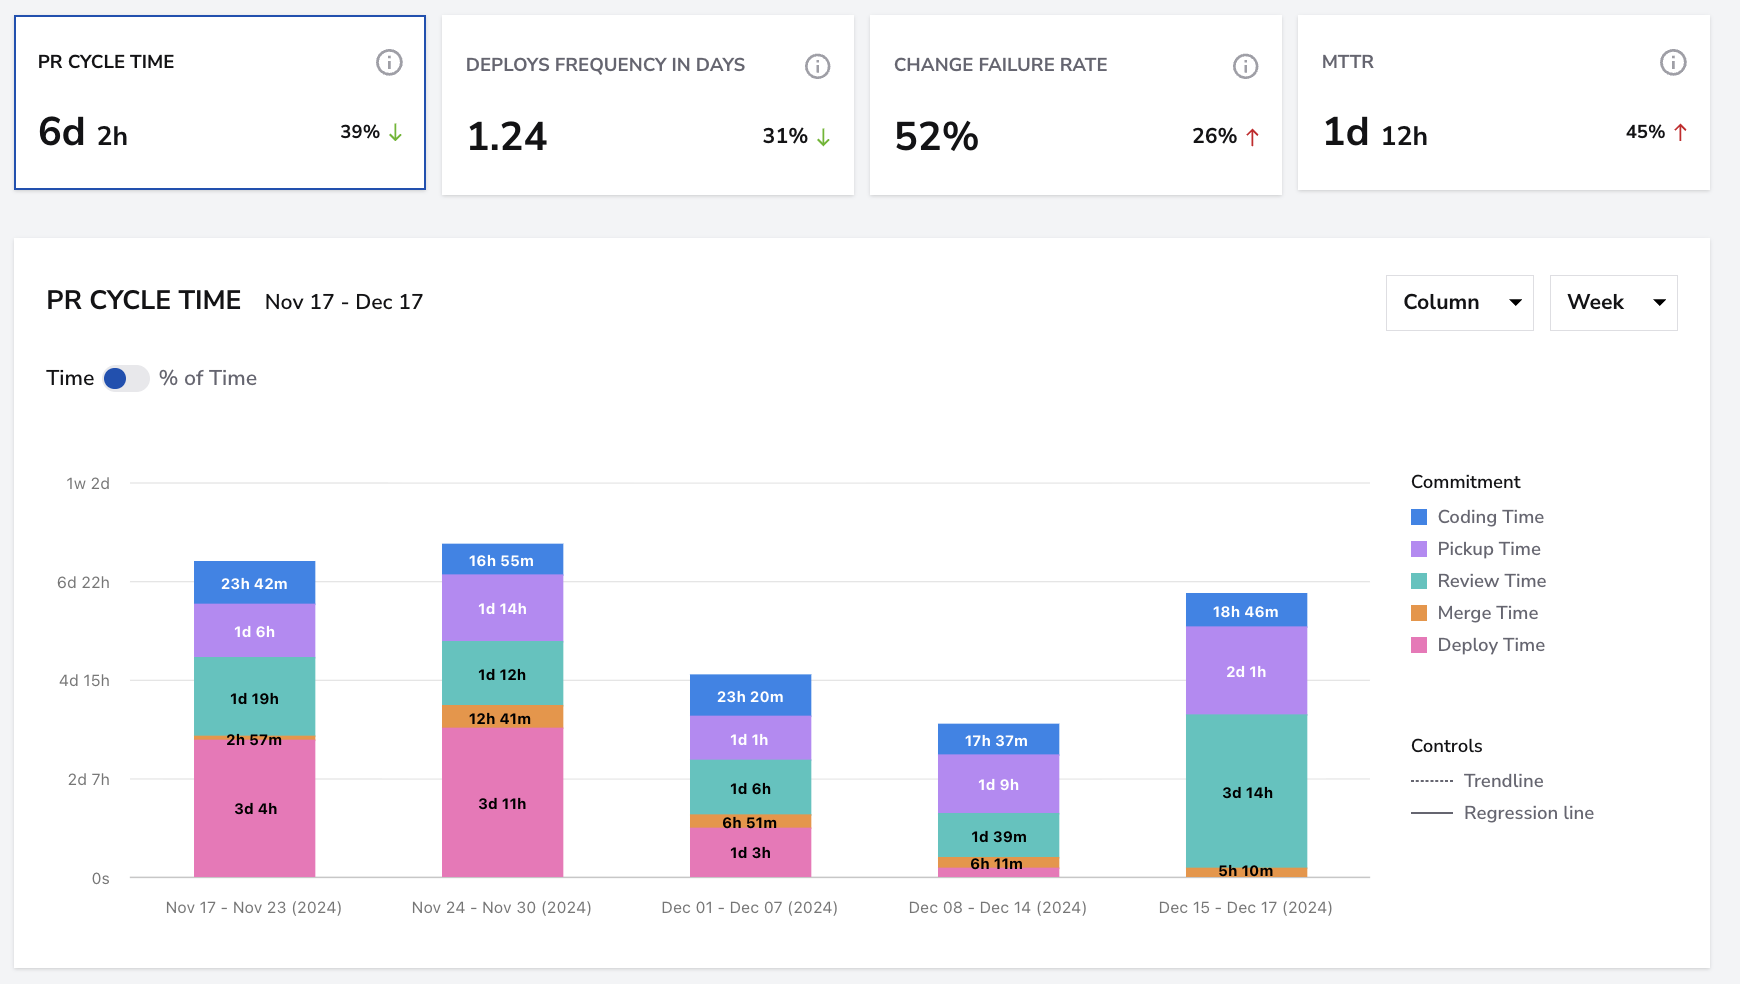
Measures the time between a PR’s creation and its merge. Fast cycle times usually indicate clear workflows and quick feedback loops. Long cycle times can signal review bottlenecks, testing delays or overly large PRs.
Deployment Frequency
Shows how often your team deploys to production. High-performing teams deploy multiple times per week or day. A lower frequency may indicate slower pipelines or larger batch sizes.
DevStats displays this metric as the average time between deploys. For example, “every 1.24 days” means the team deploys about every 1 day and 6 hours.
Use the Deploy API to ensure every deploy is tracked precisely.
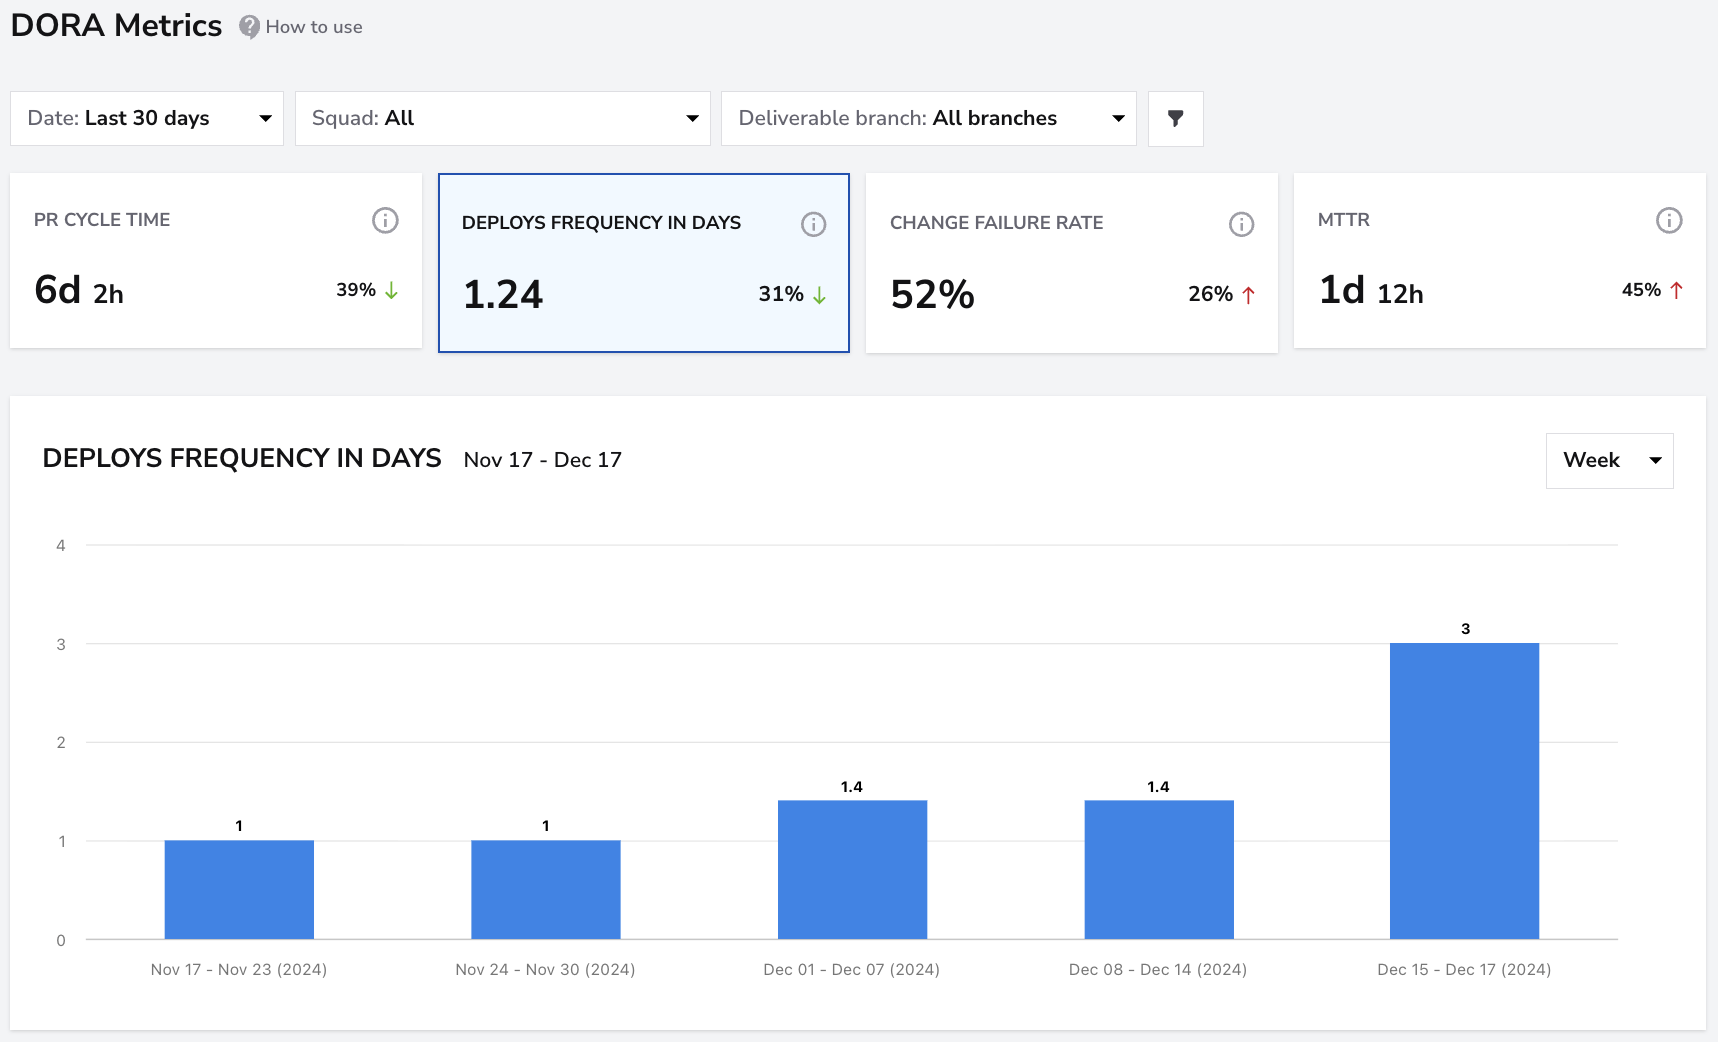
You can improve the accuracy of this metric by submitting deployment events through the Deploy API, ensuring each production release is properly recorded in DevStats. 👉Learn how to use the Deploy API.
Change Failure Rate
Shows the percentage of deployments that result in a production incident. This metric helps quantify release stability.
DevStats can track change failures automatically via: • Git prefixes such as hotfix or bugfix • Manually declared incidents • Incident events submitted via API
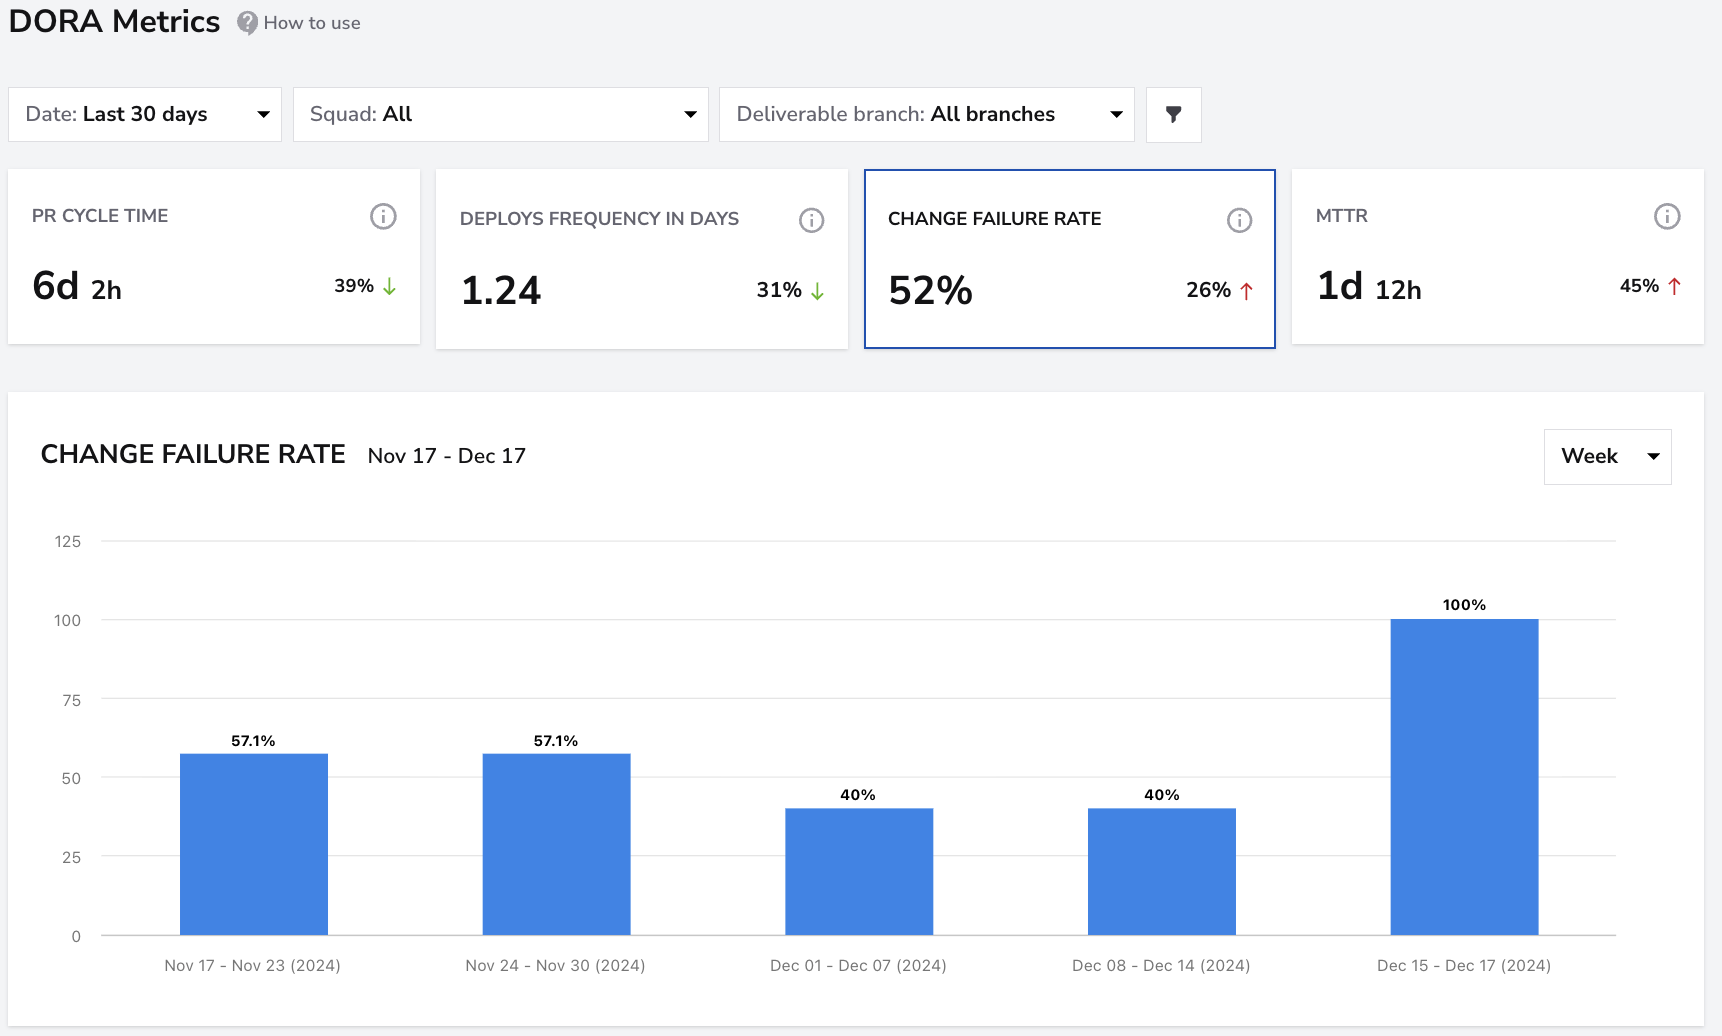
Change failures can be tracked automatically using branch prefixes like
hotfixorbugfix, by declaring incidents in Incident Management, or via the DevStats Incidents API.
👉 Learn how to declare incidents via API.
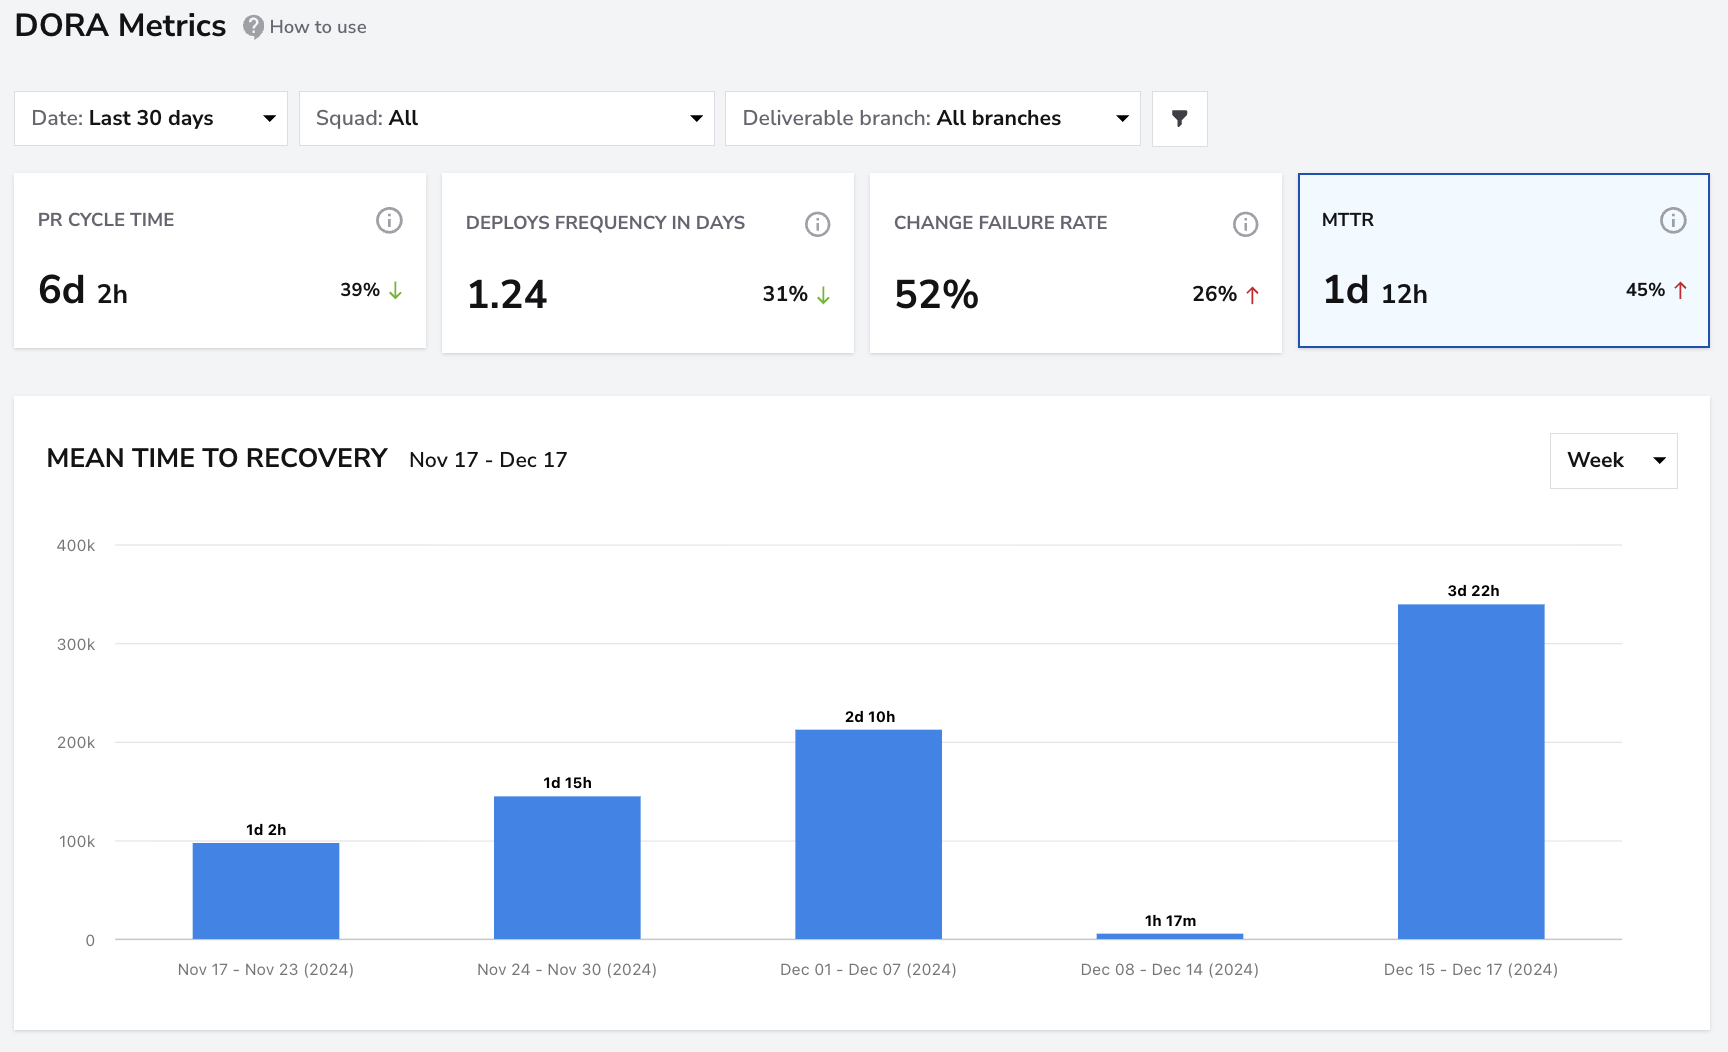
Mean Time to Restore (MTTR)
Measures how long it takes to resolve an incident and restore normal service. This metric highlights responsiveness, on-call efficiency and operational resilience.
Accurate MTTR depends on consistent incident tracking.
Other Snapshot Metrics
DORA gives you the big picture of throughput and stability. Snapshot reports in DevStats add context by showing what is driving those numbers in terms of flow, throughput and collaboration!
These views are especially useful when you see a change in a DORA metric and want to understand why it is happening.
Speed
The Speed report focuses on how quickly work moves through the delivery pipeline.
At the top you see: • PR Cycle Time • Deploys Frequency in days • Issue Cycle Time
The PR Cycle Time chart breaks the work into stages such as Coding, Pickup, Review, Merge and Deploy time. This helps teams see where time is actually being spent and identify the main bottlenecks.
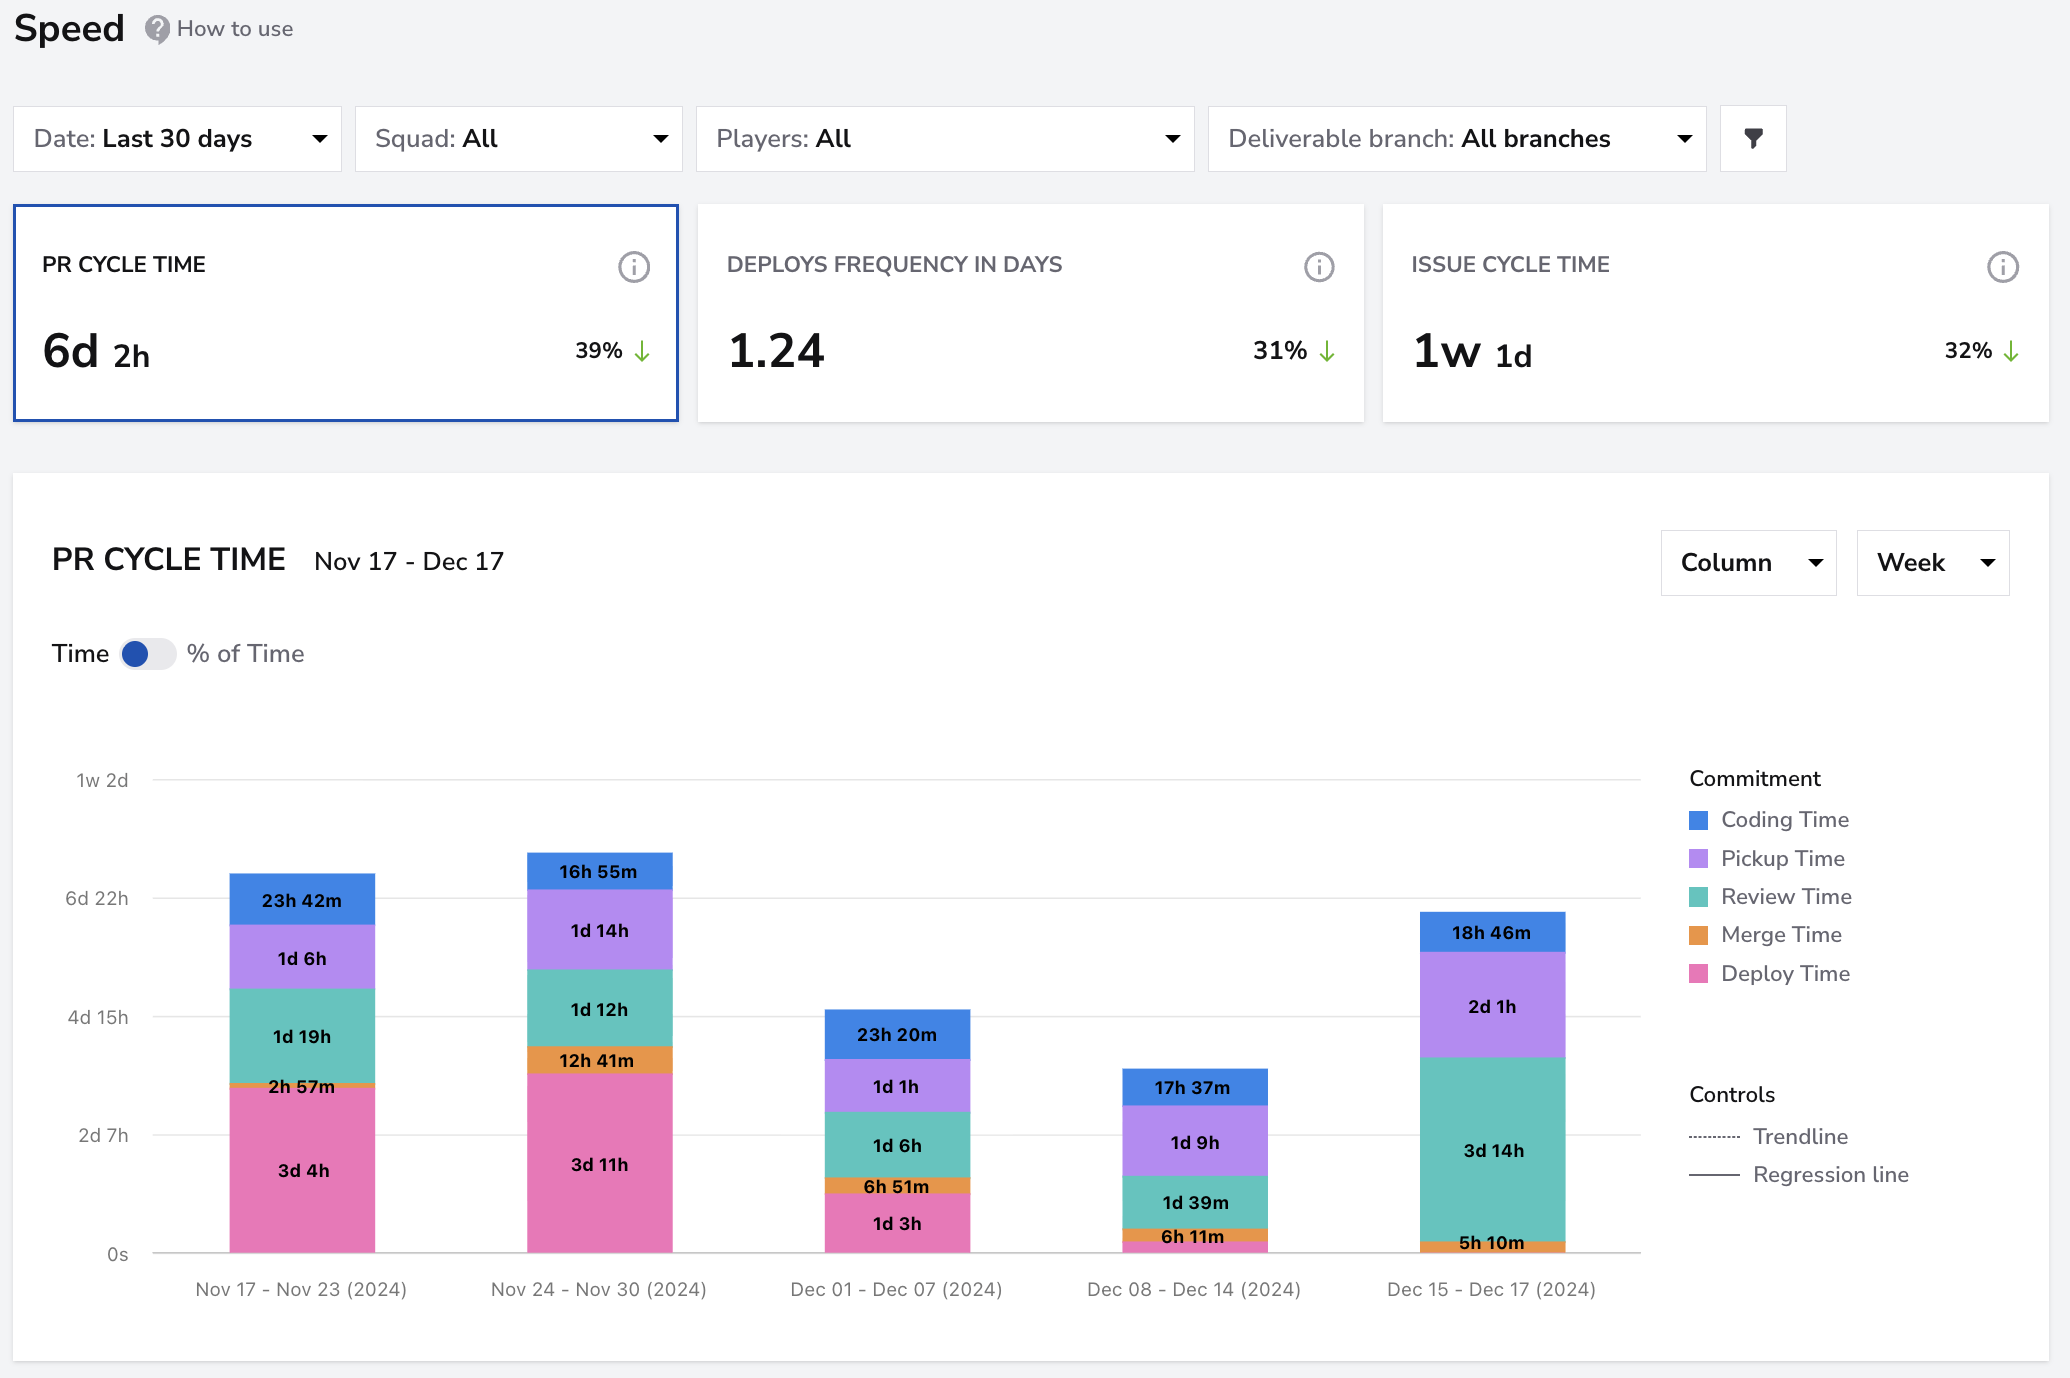
Use this report when PR Cycle Time or Deployment Frequency change and you want to understand whether the slowdown is caused by development, reviews or deployment steps.
Productivity
The Productivity report shows how much work is being shipped.
Key metrics include: • PRs merged • Days with commits • Issues resolved
The chart of Pull Requests merged is broken down by type, such as Feature, Bug, Enhancement, Hotfix and Other. This makes it easy to see the mix of work and whether the team is spending more time building new features or fixing problems.
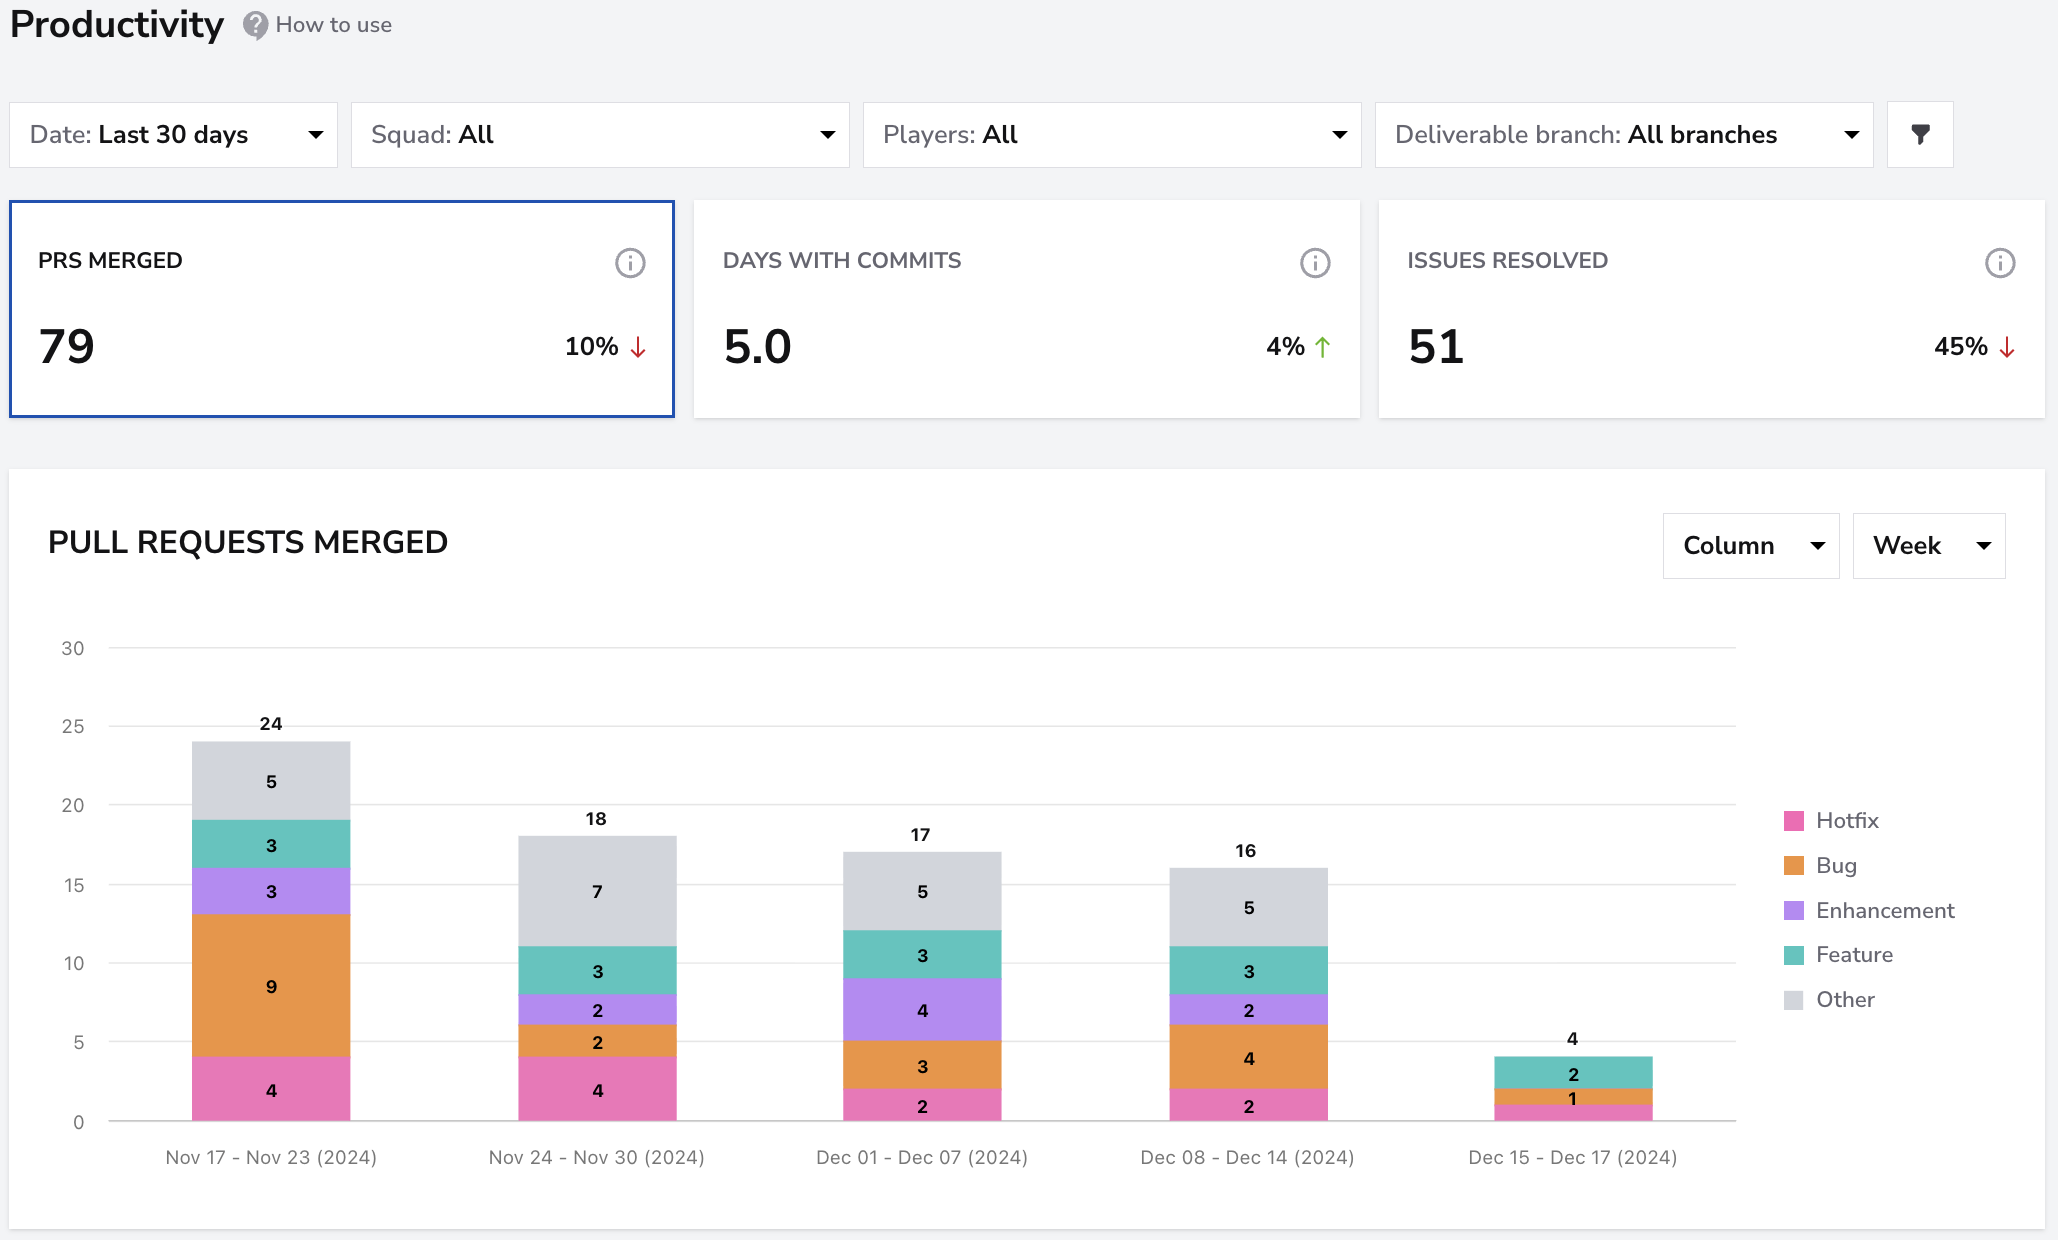
Use this report when you want to understand throughput and the balance between feature work, enhancements and fixes.
Collaboration
The Collaboration report highlights how people work together around code.
It surfaces metrics such as: • Reviews completed • Comments per review • PRs merged without review
The chart shows how many code reviews were completed over time. Spikes or drops can reveal overloaded periods, missing reviewers or changes in review practices.
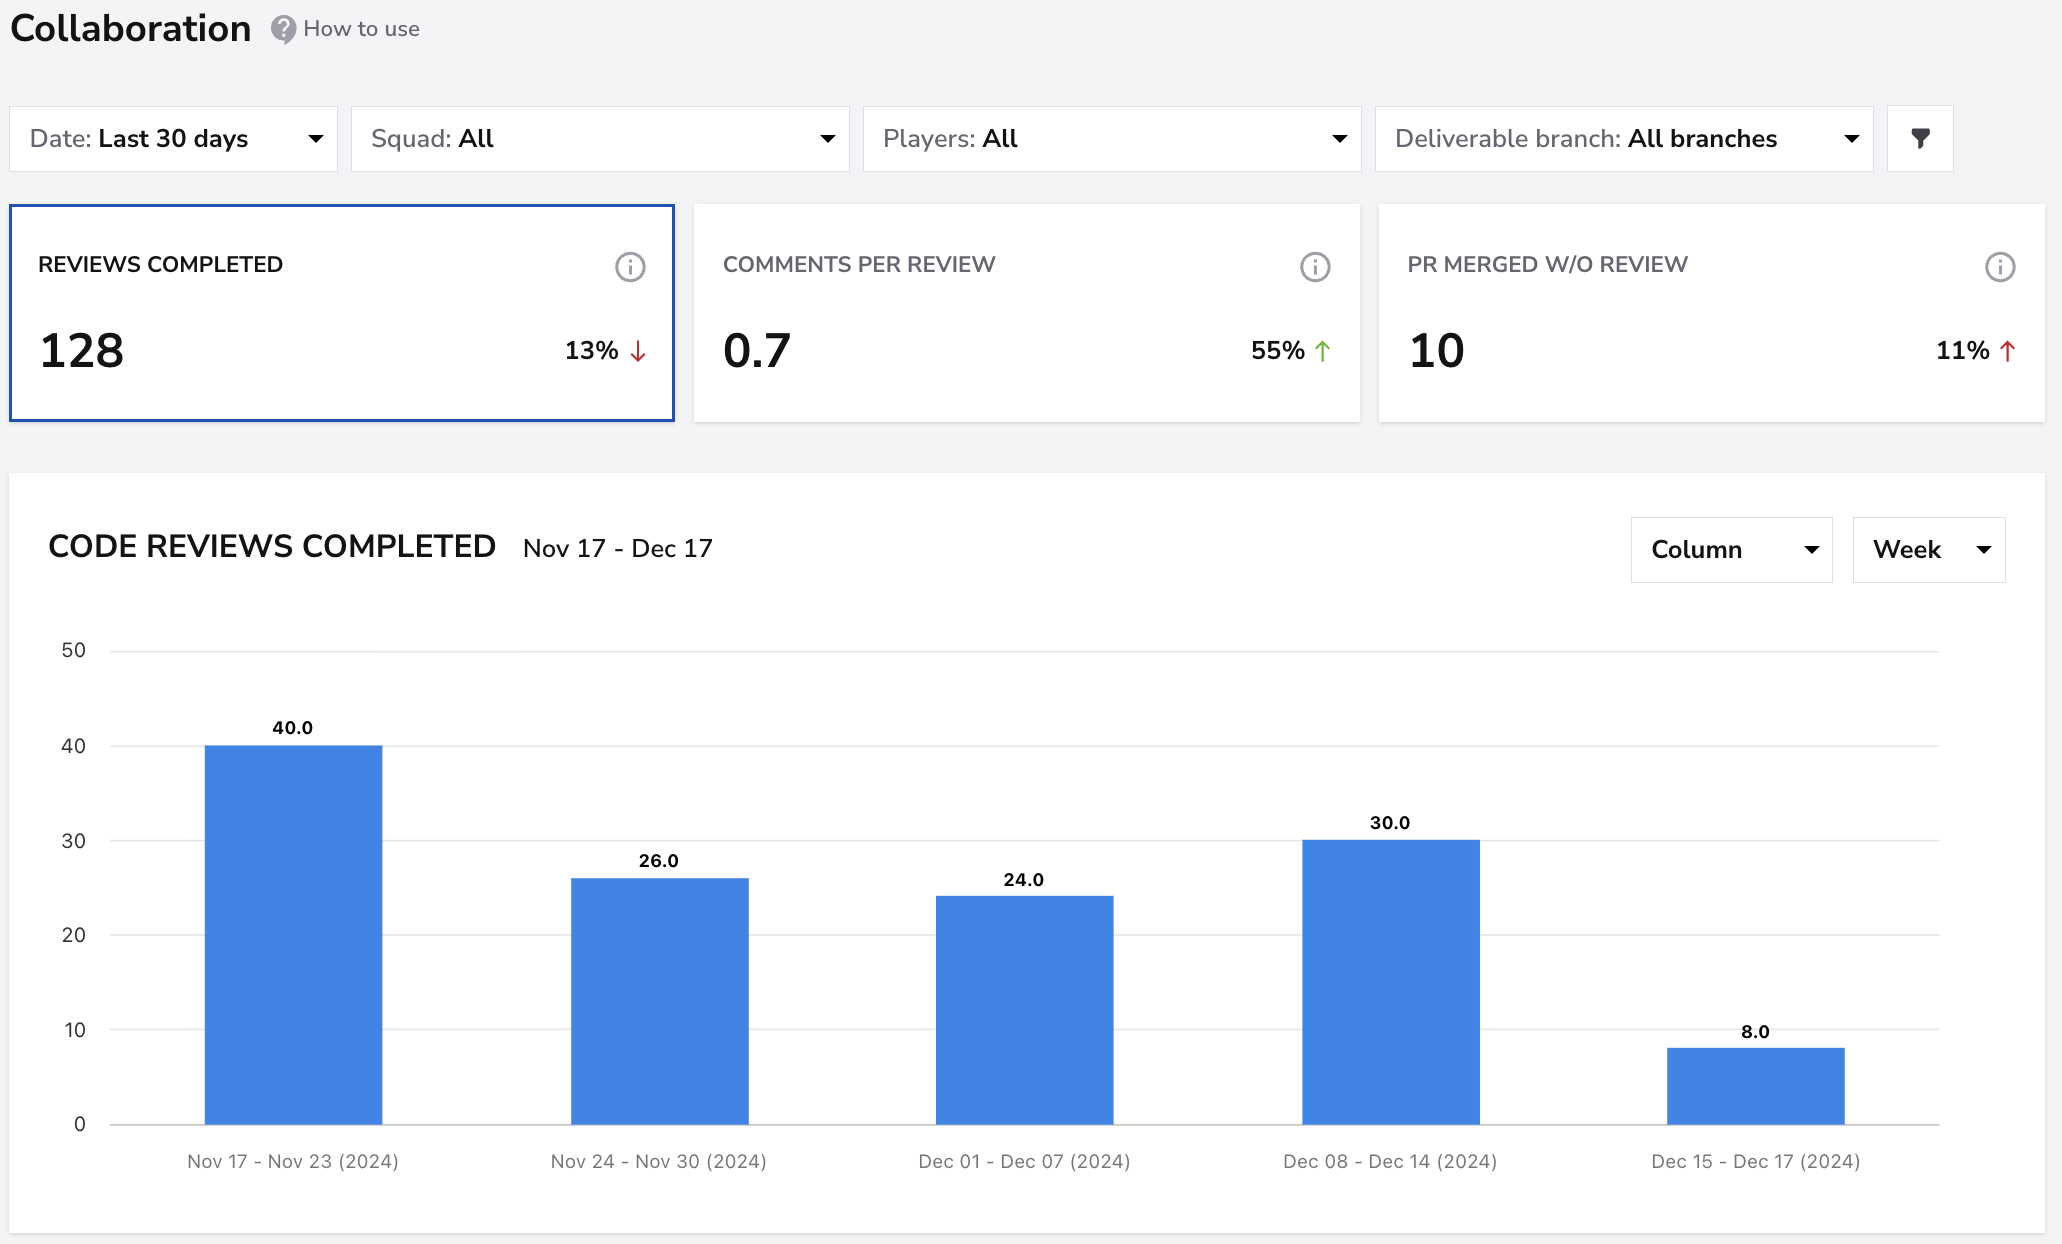
Use this report when you want to improve review culture, reduce solo merges or ensure that knowledge is shared across the team.
Benchmarks
The Benchmarks report puts your metrics in context.
It displays gauges for PR Cycle Time, Issue Cycle Time, Change Failure Rate and other indicators, mapped into zones such as Elite, Strong, Fair and Needs Focus. It also includes metrics like Planning Accuracy.
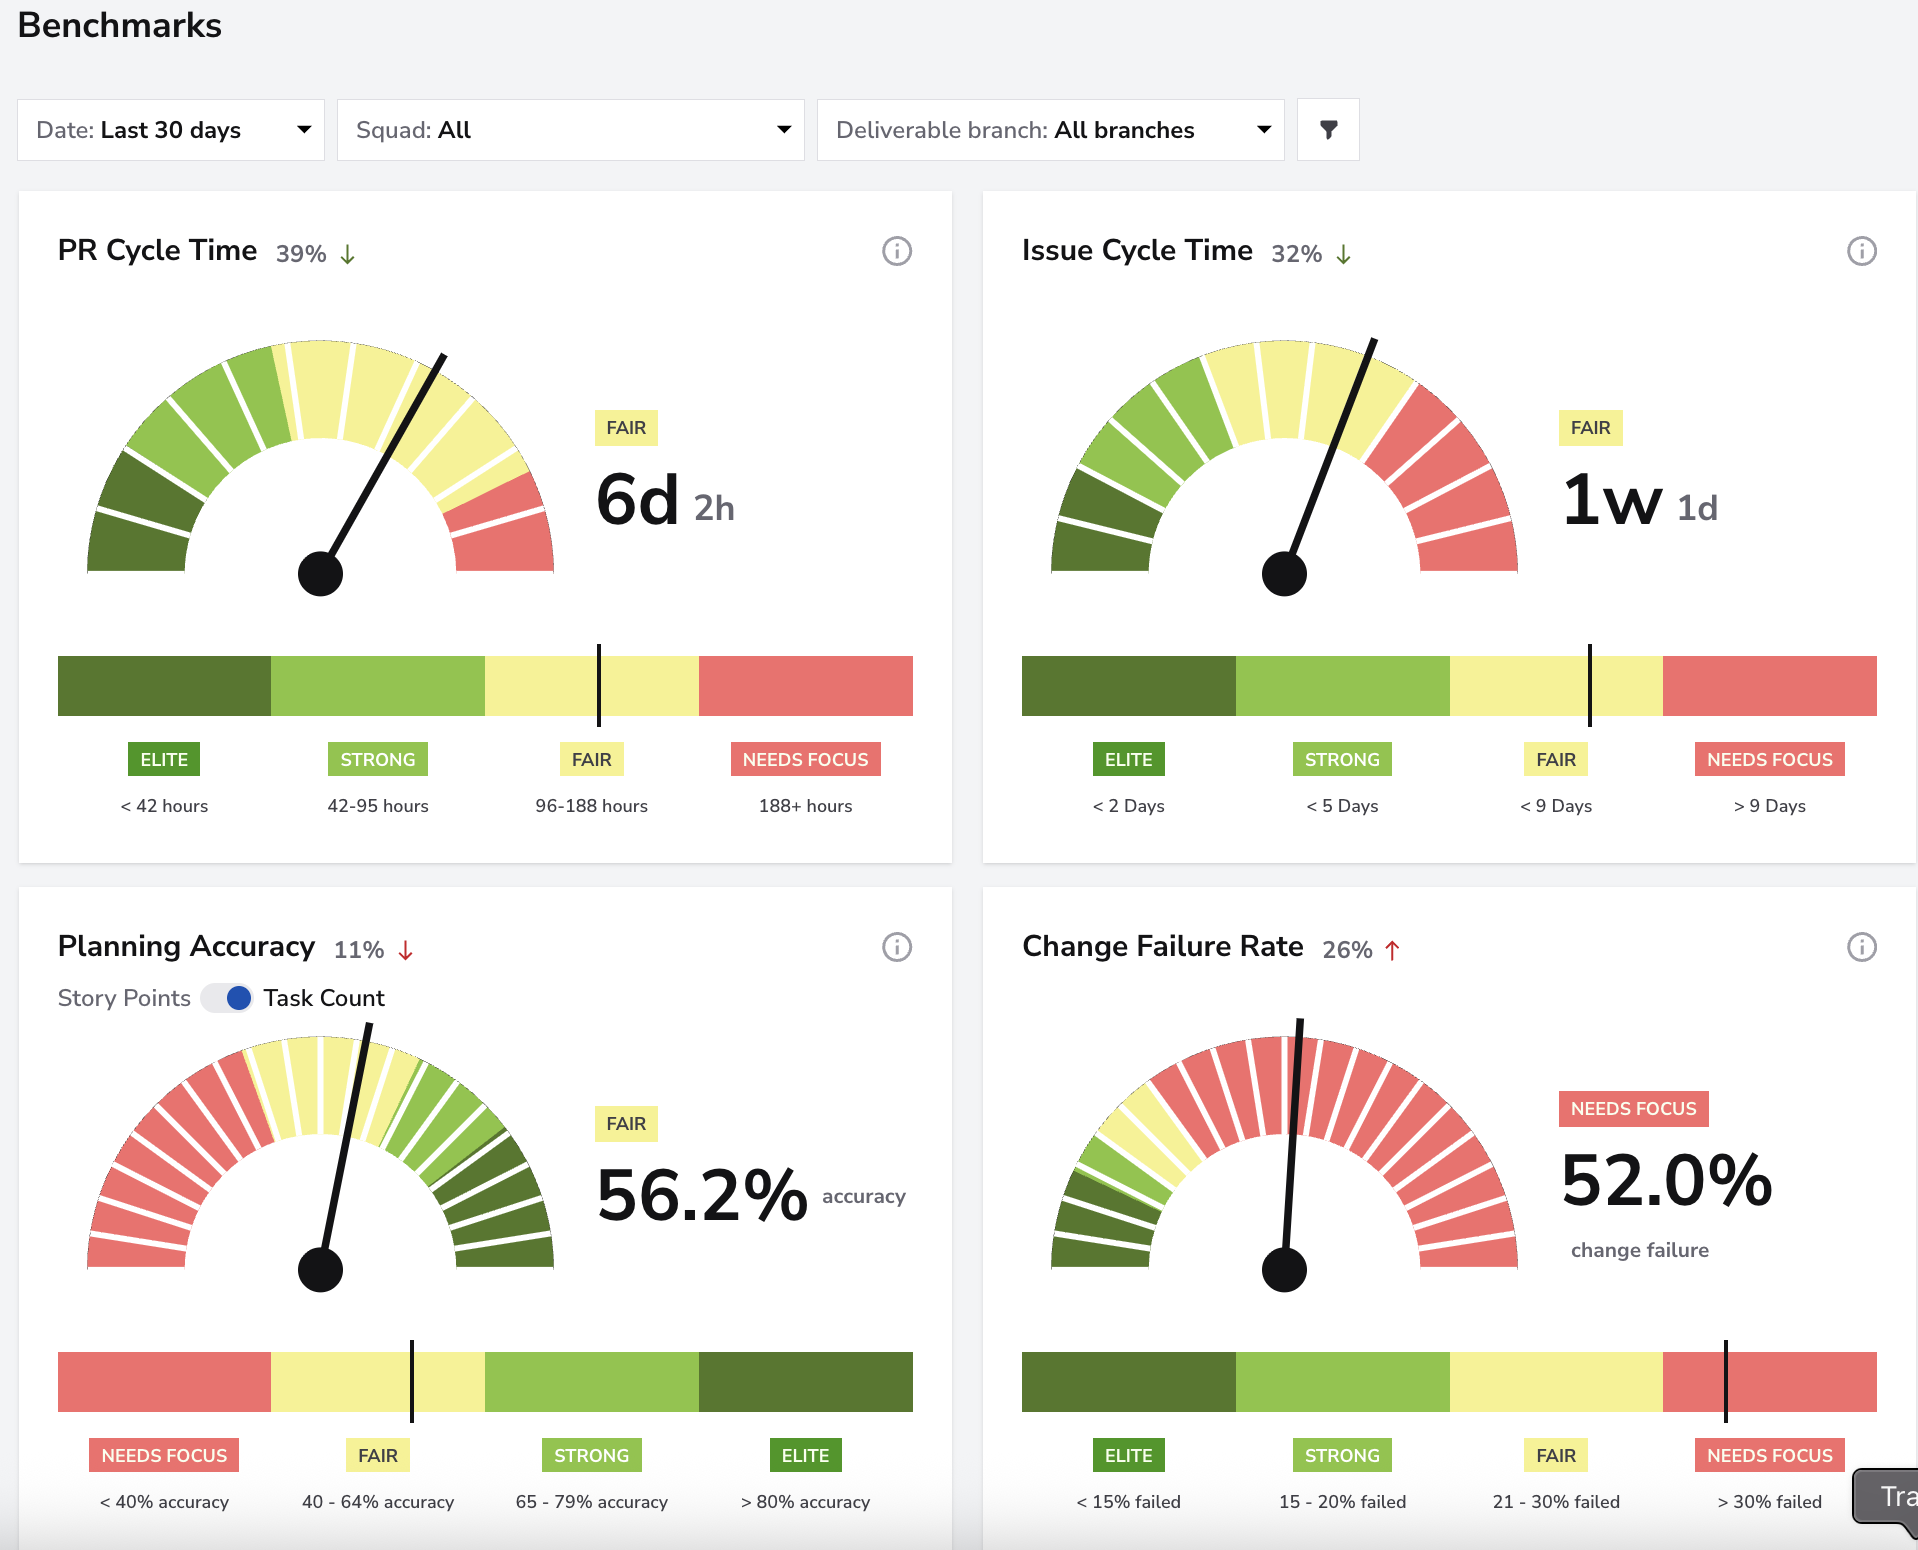
Use this view to: • See whether your DORA (and other) metrics are in a healthy range • Quickly spot which areas need attention • Communicate performance in a way that is easy to understand for stakeholders
Benchmarks work as a companion to DORA metrics. You get a high-level signal of where you stand and where to focus next.
Optimizing Software Delivery
To get the most value from DORA metrics:
• Monitor them regularly to understand trends. • Investigate deviations using Snapshot views. • Use insights to refine workflows and reduce friction. • Encourage fast feedback, continuous learning and iterative improvement. • Align delivery outcomes with business goals such as faster time-to-market or reduced incident impact.
Summary
The DORA & Snapshot Metrics Dashboard in DevStats gives teams a simple, automated and reliable way to understand delivery performance. By tracking PR Cycle Time, Deployment Frequency, Change Failure Rate and MTTR, engineering leaders gain a clear picture of efficiency, stability and overall delivery health, turning data into actionable improvements.