What is the Activity Heatmap Feature?
TheActivity Heatmap Feature visualizes your team’s work patterns by displaying development activities—such as code commits, pull request updates, comments, and task management—across different times of the day and week.
By highlighting periods of high and low activity, the heatmap provides insights into when your team is most productive, helping you protect developer focus, reduce unnecessary interruptions, and optimize collaboration. It’s essential for fostering a productive and balanced work environment while aligning team schedules with natural activity rhythms.
Metrics
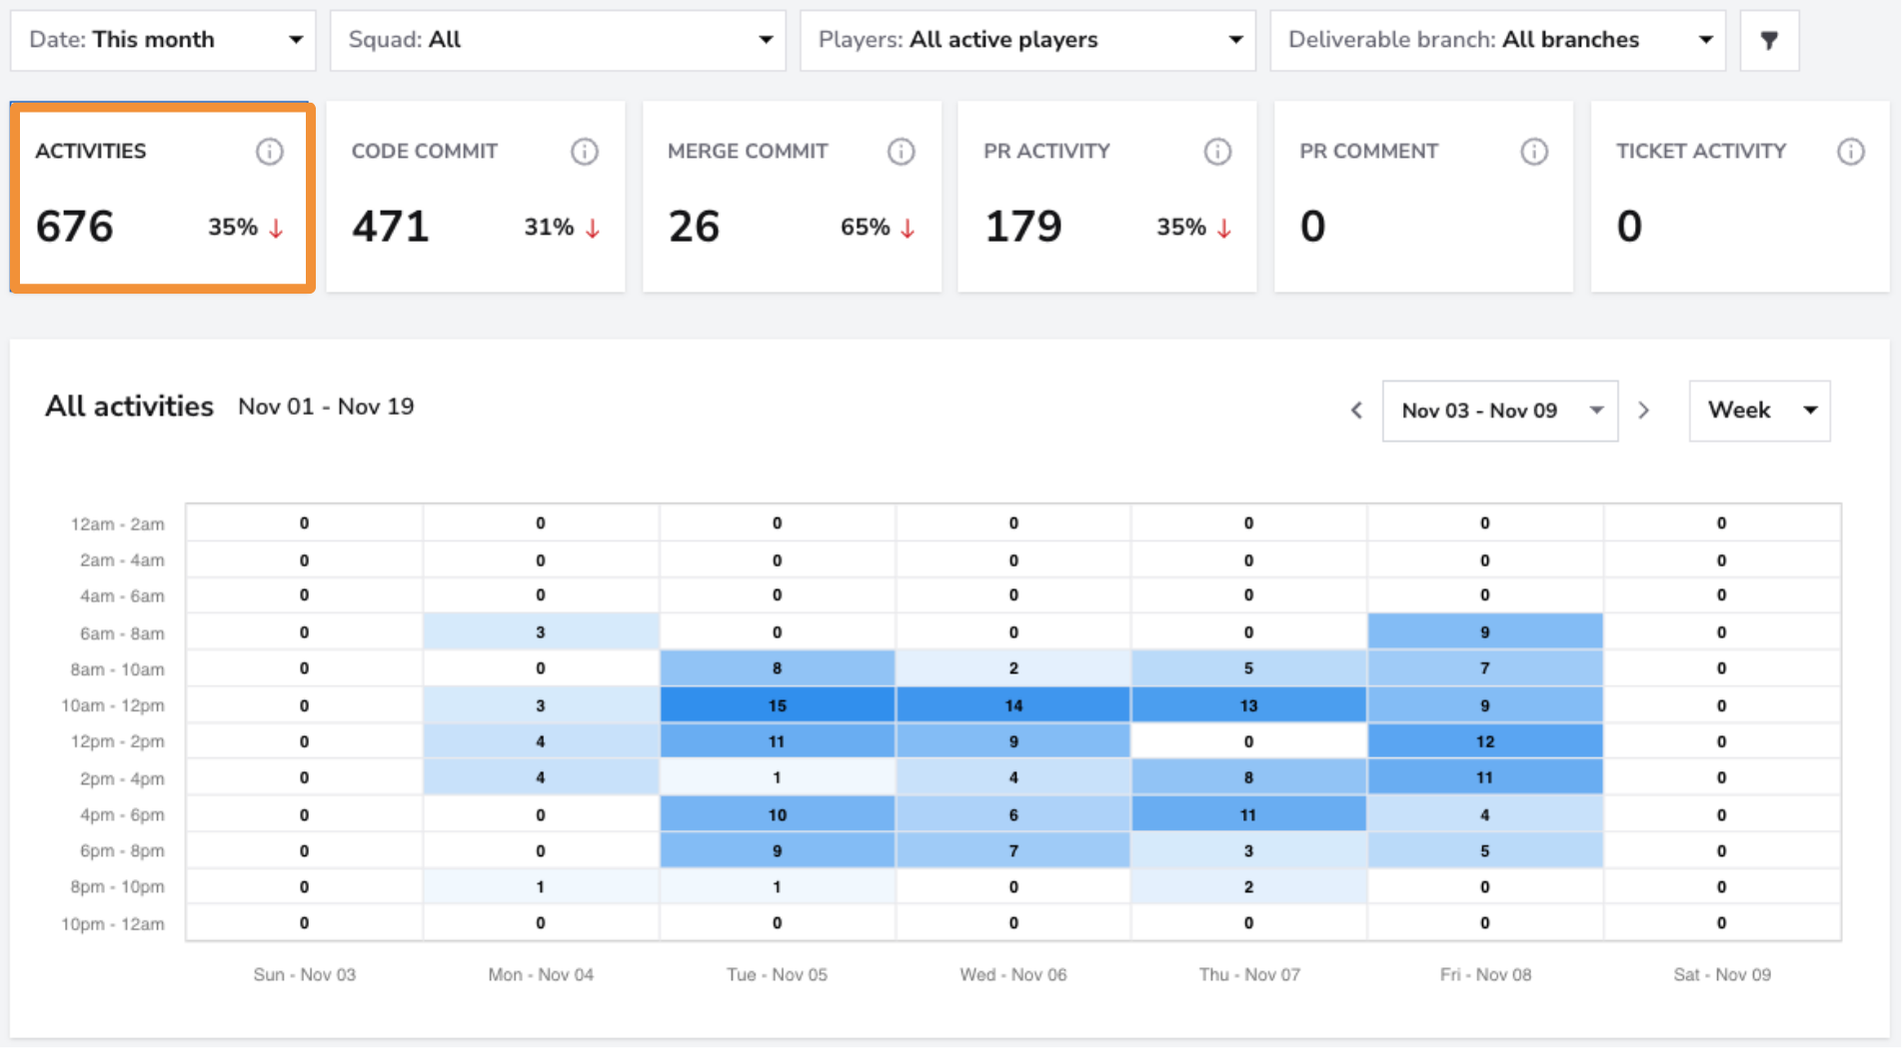
Activities
- What: Represents the total number of development-related activities over the selected period.
- Why it matters: This aggregate metric provides a high-level view of the team's overall engagement and work patterns, highlighting peak and low activity periods.
- How to use it: Use this metric to assess the team’s productivity trends and determine if work is evenly distributed or clustered into specific times.
- User interface:
Code Commits
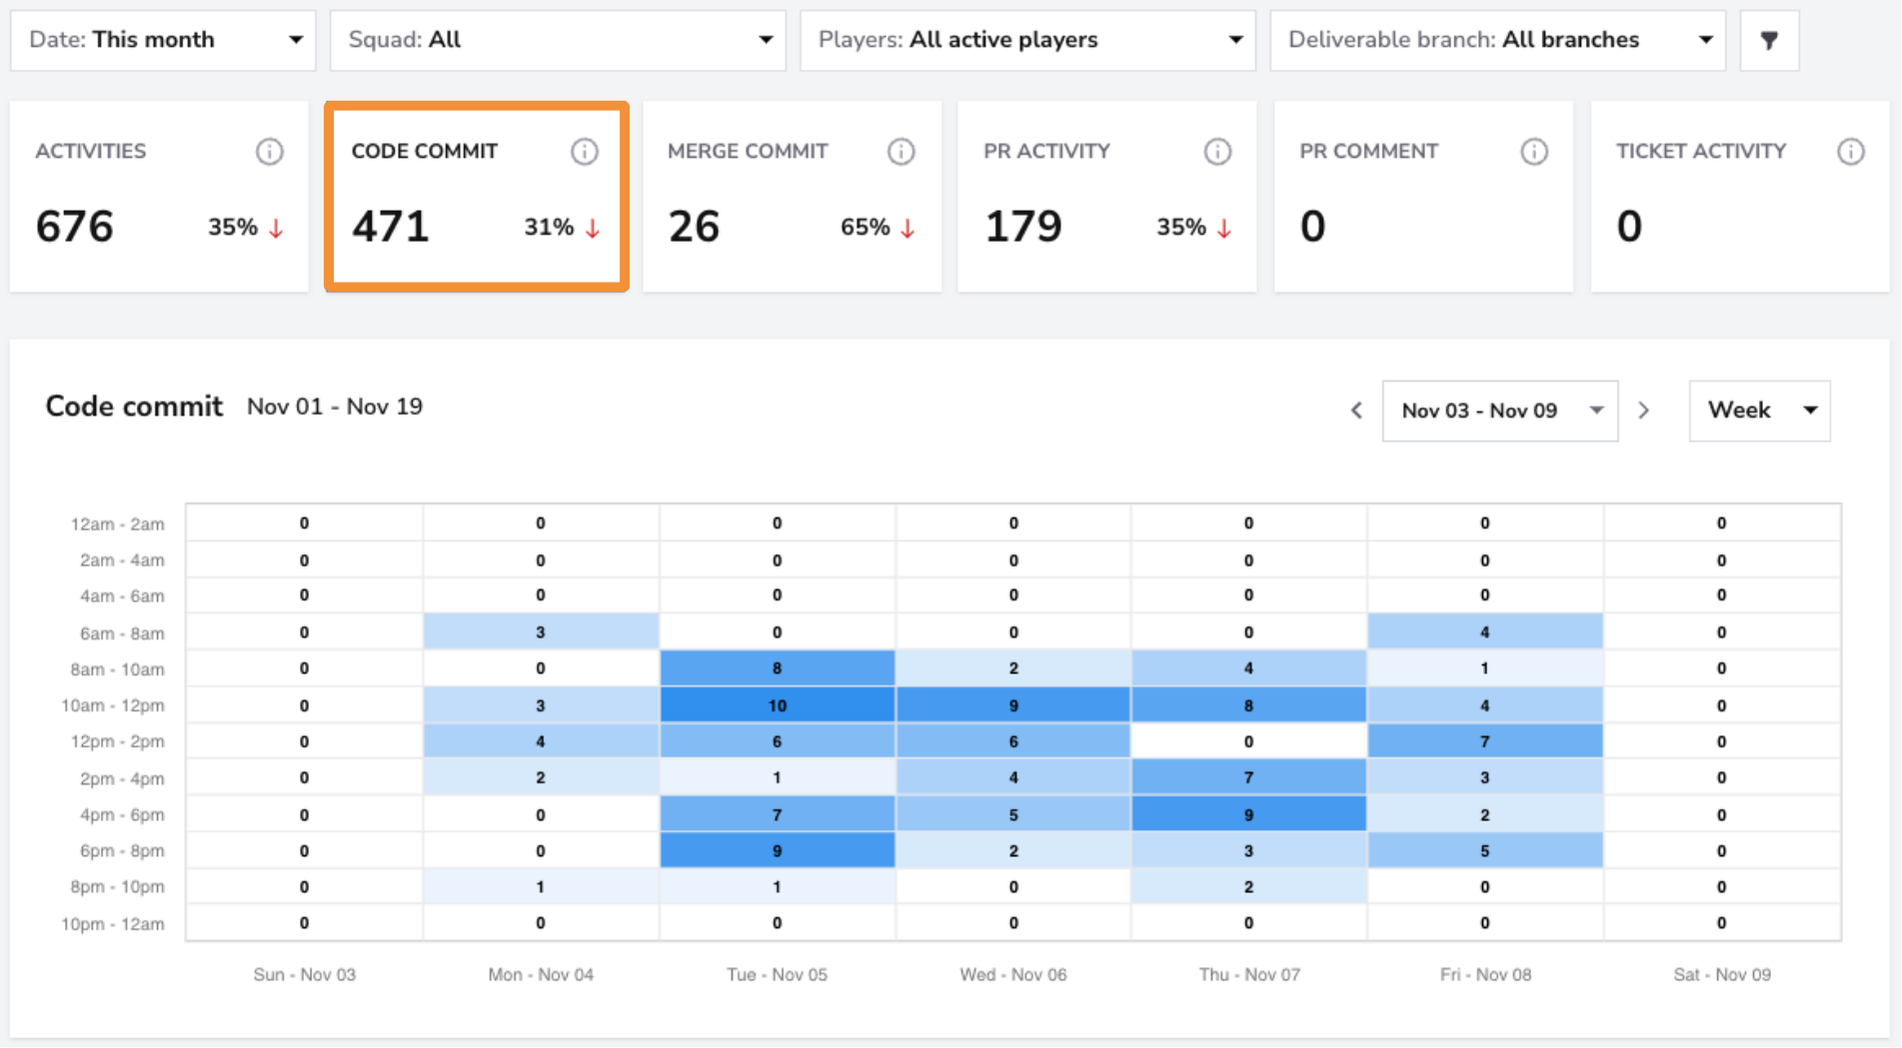
- What: Tracks the total number of code commits made by the team during the selected timeframe.
- Why it matters: Code commits are a key indicator of development activity and rhythm, reflecting how frequently the team is making progress on the codebase.
- How to use it: Monitor commit activity to ensure steady progress and align it with team goals. Sudden dips or bursts may signal bottlenecks or inefficiencies in the workflow.
- User interface:
Merge Commits
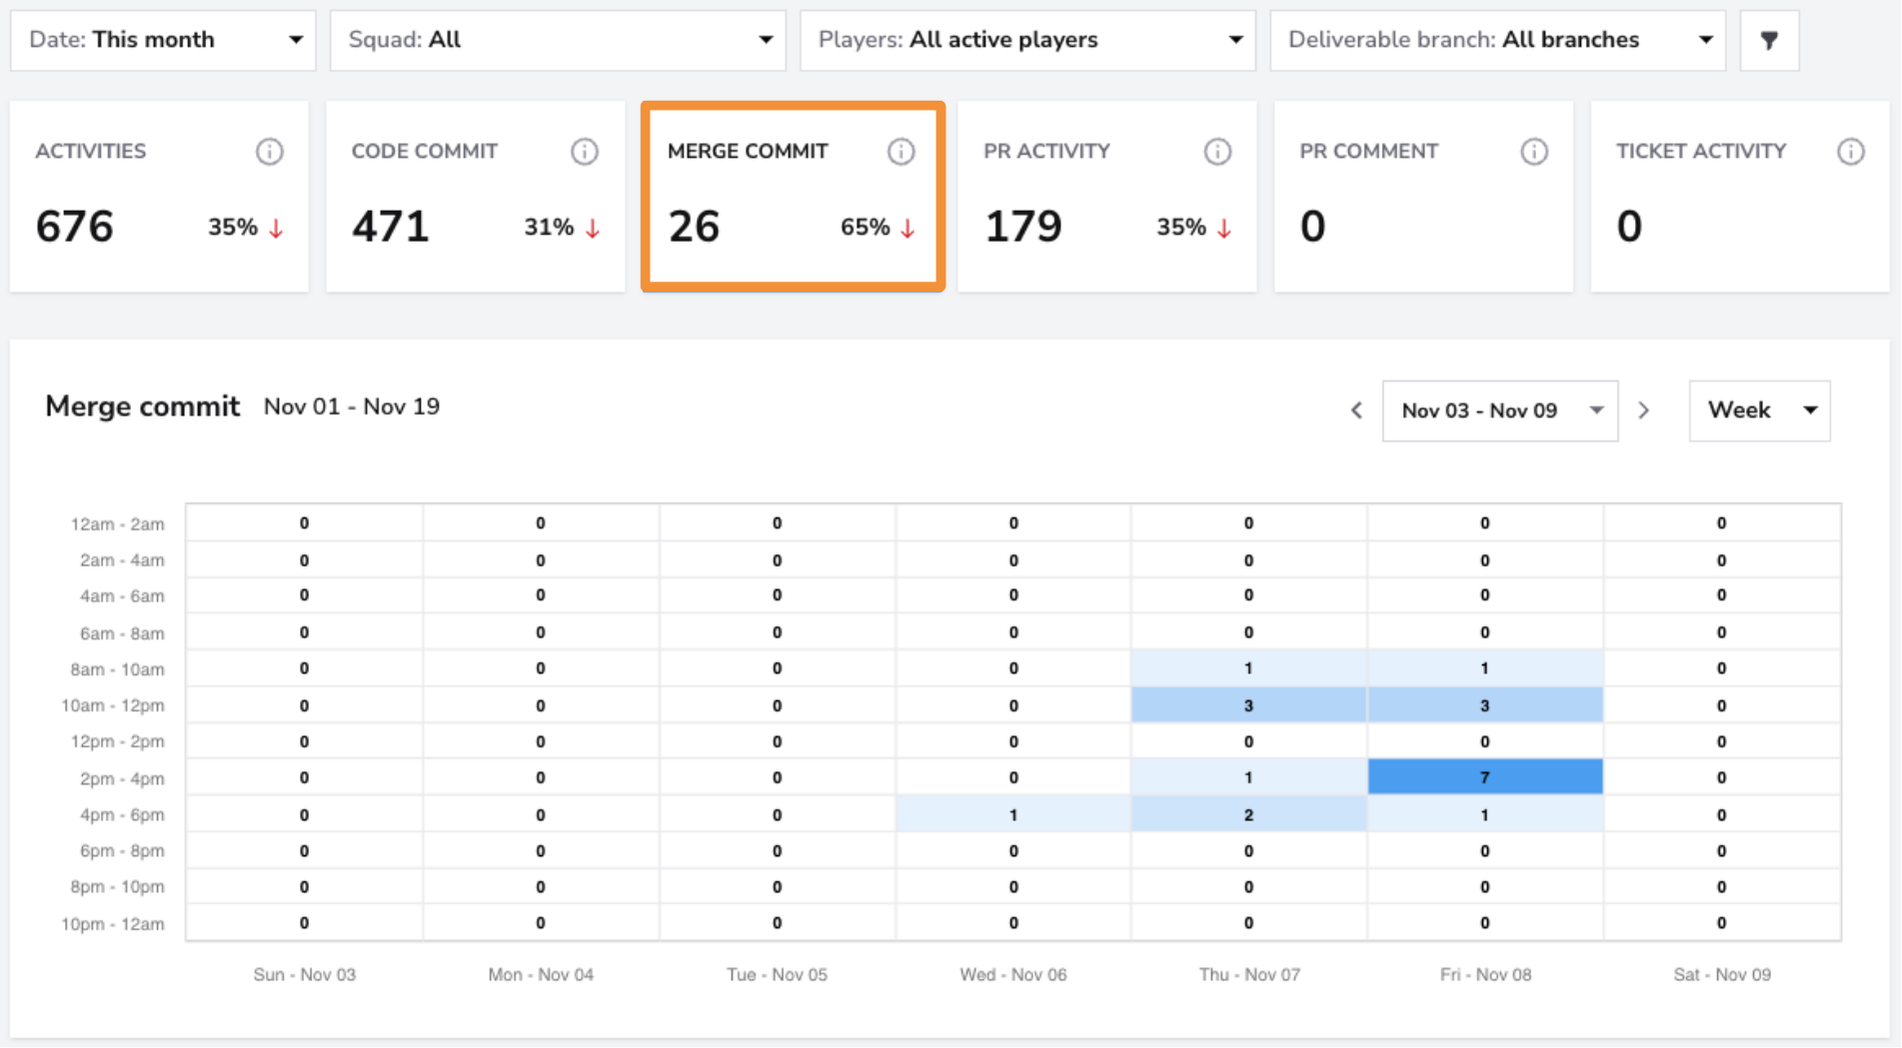
- What: Displays the number of merge commits recorded, indicating how often changes are integrated into the main branch.
- Why it matters: Merge commits reflect the team’s ability to complete and finalize work. A consistent number of merges indicates steady progress, while fluctuations might signal delays in review or testing.
- How to use it: Use this metric to identify work completion patterns and detect potential bottlenecks in the review or deployment process.
- User interface:
PR Activity
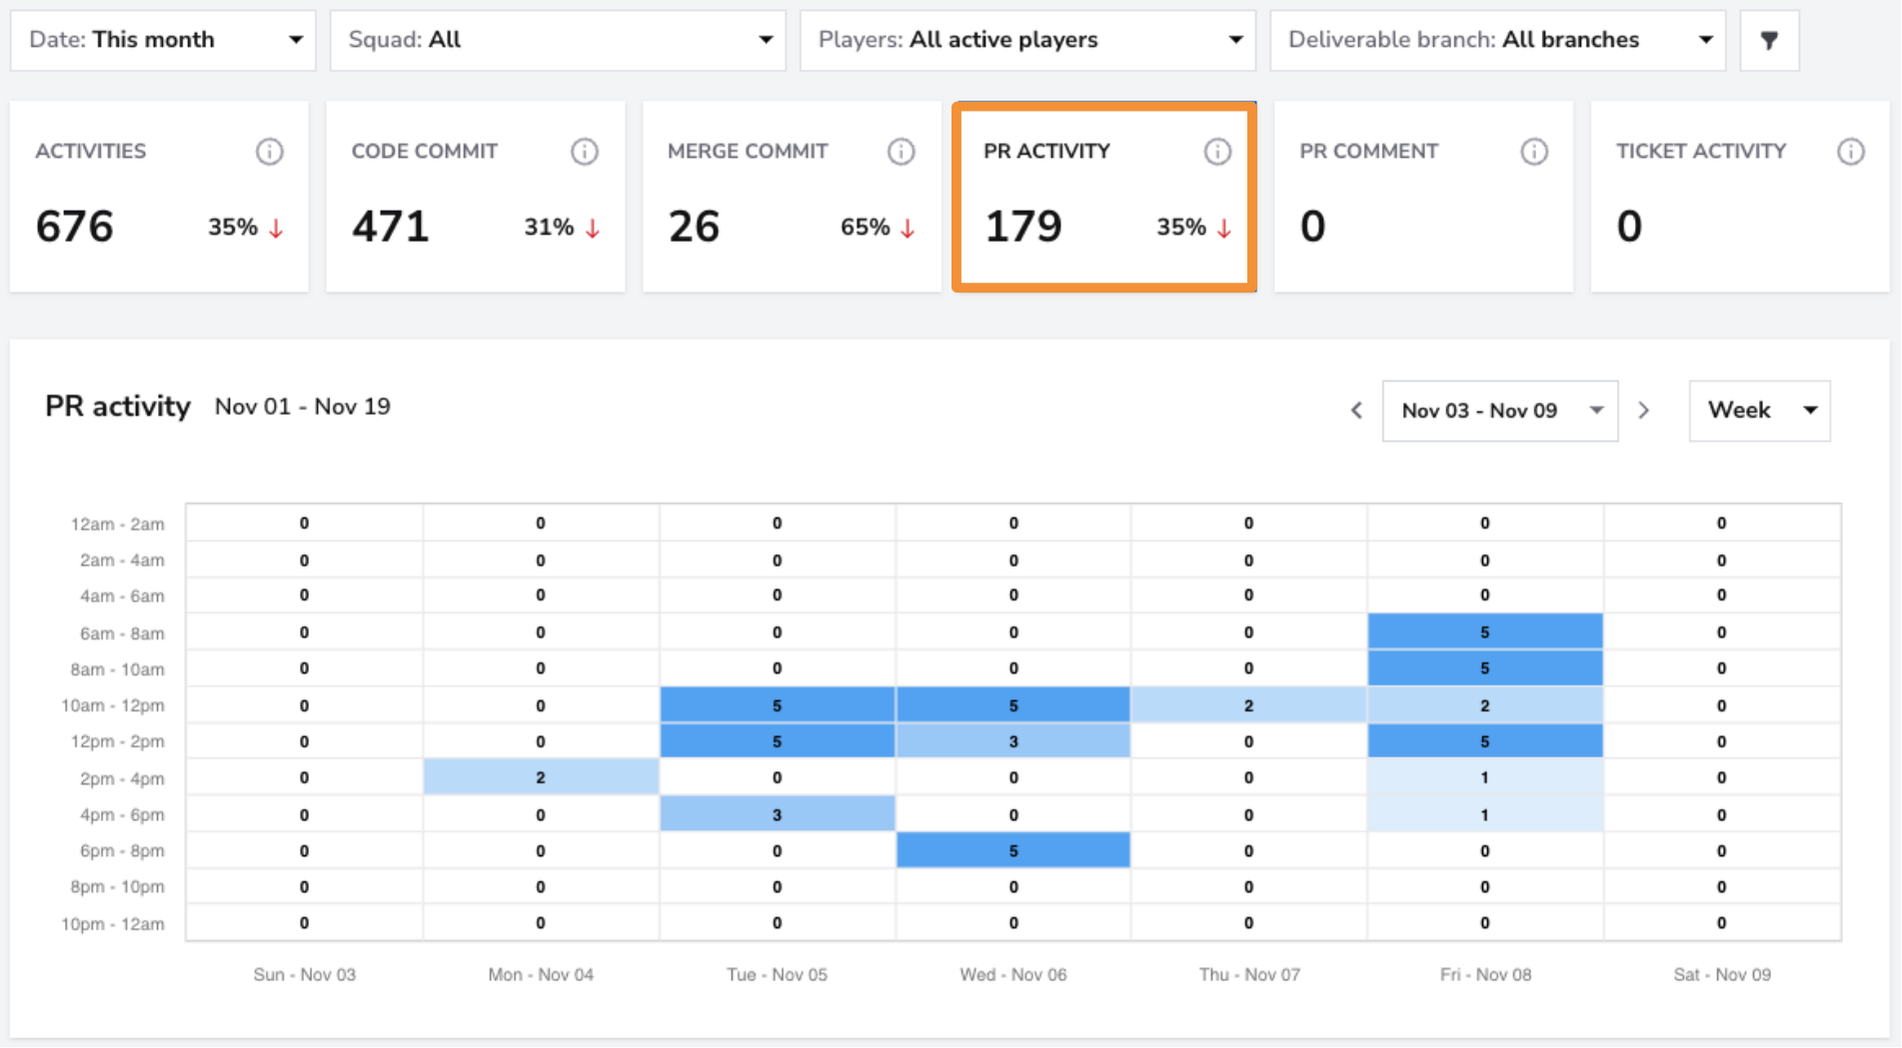
- What: Shows the total number of pull request-related activities, including creating, updating, or closing PRs.
- Why it matters: PR activity provides insight into how actively the team is progressing code changes through the review process, a critical step in maintaining code quality.
- How to use it: Analyze PR activity to ensure the team maintains a consistent review cycle and progresses code changes efficiently.
- User interface:
PR Comments
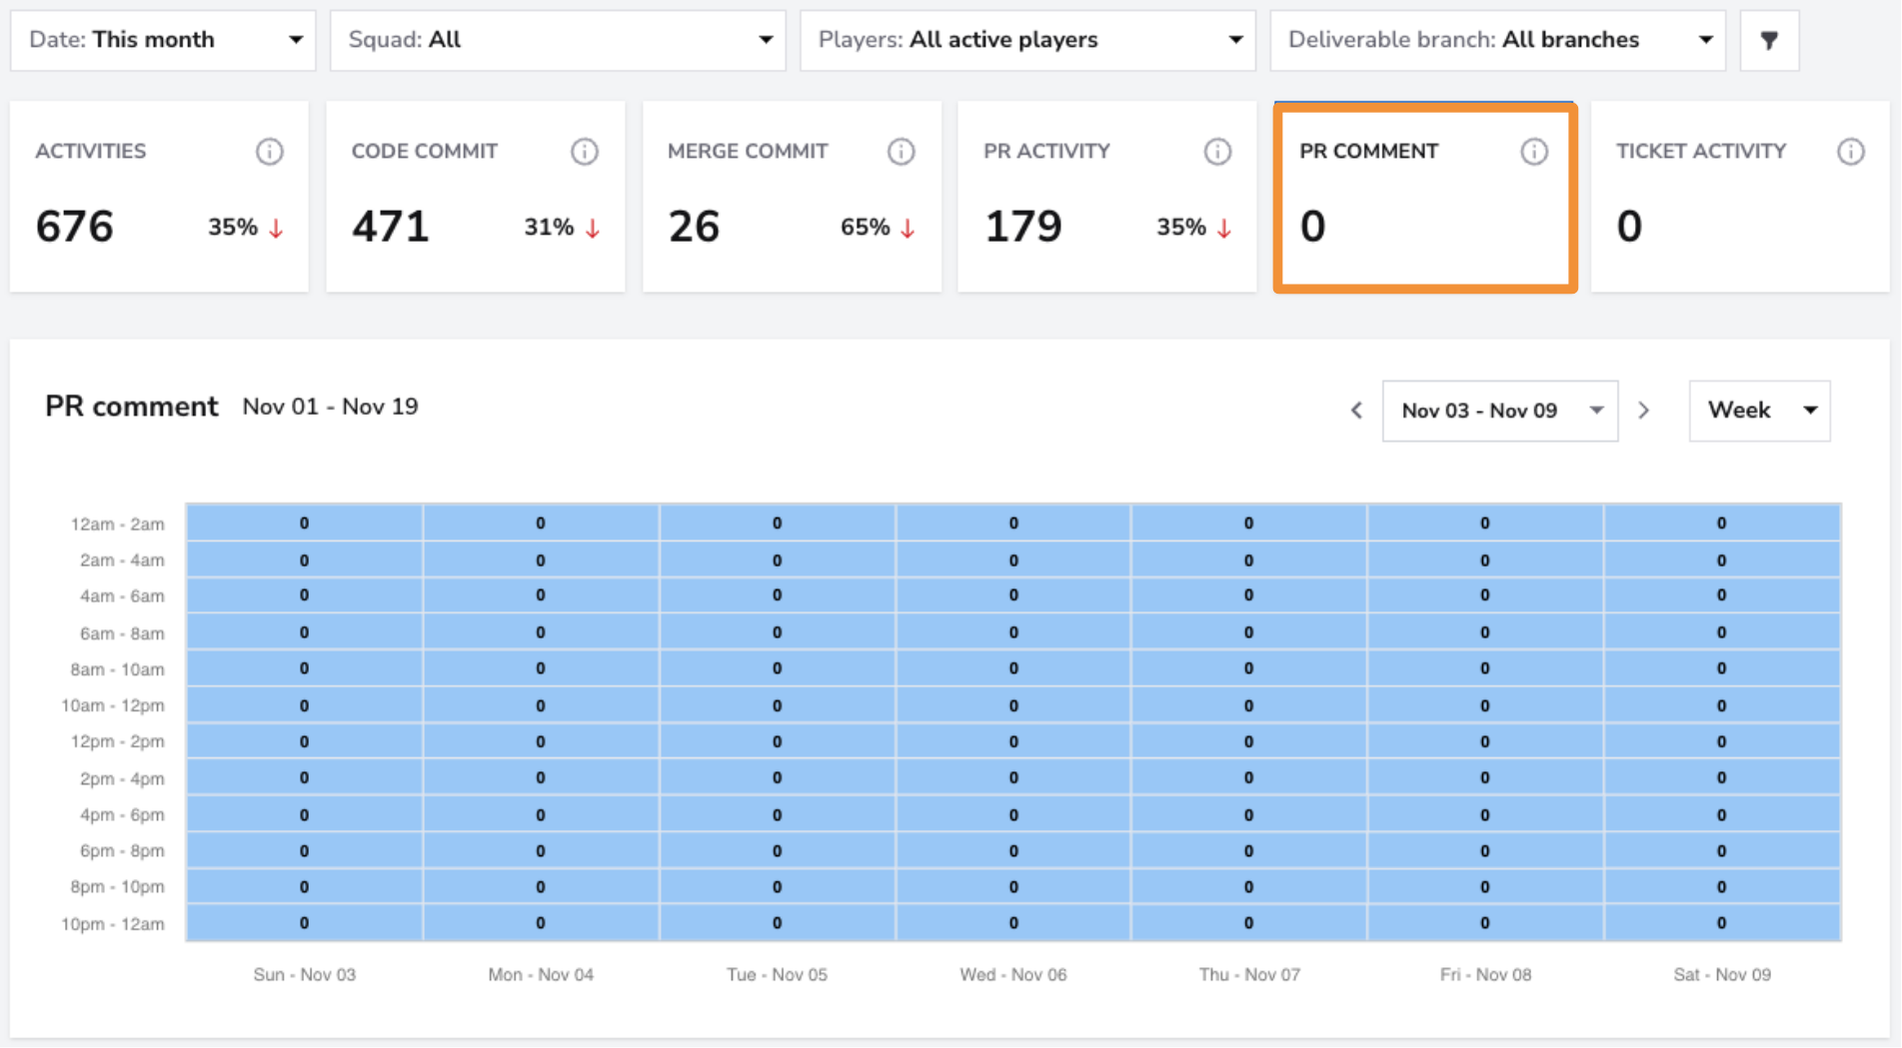
- What: Tracks the total number of comments made on pull requests.
- Why it matters: PR comments reflect the level of communication and feedback during the code review process. A higher number of comments often indicates more thorough reviews and better collaboration.
- How to use it: Monitor this metric to ensure constructive feedback and comprehensive reviews. Low comment activity may signal the need for deeper engagement in the review process.
- User interface:
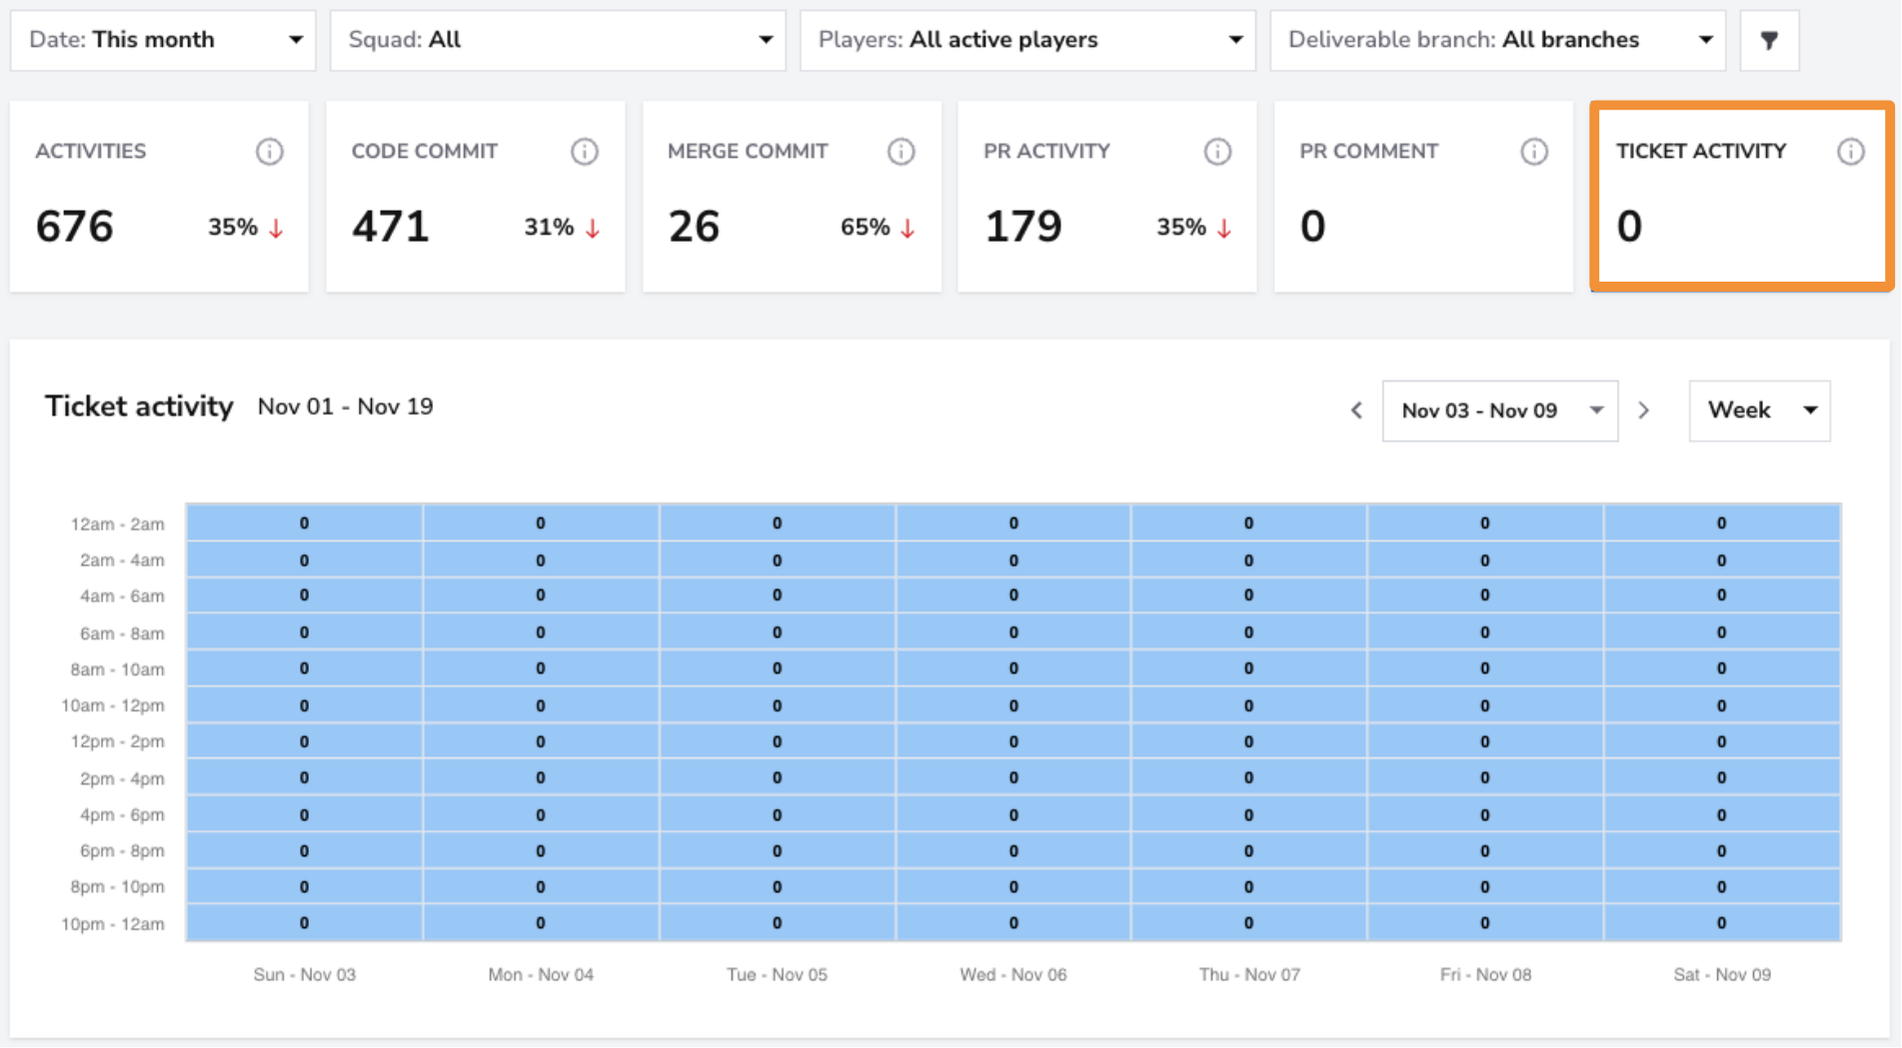
Activity Heatmap Dashboard
The Activity Heatmap Dashboard visualizes your team’s activity across different times of the day and week. The darker the shade, the higher the activity during that time period.
Filters
Use the Squad Filter to view Activity Heatmao metrics for individual squads. If you want a broader overview of all teams, select the "All" filter to see the breakdown across all squads at once.

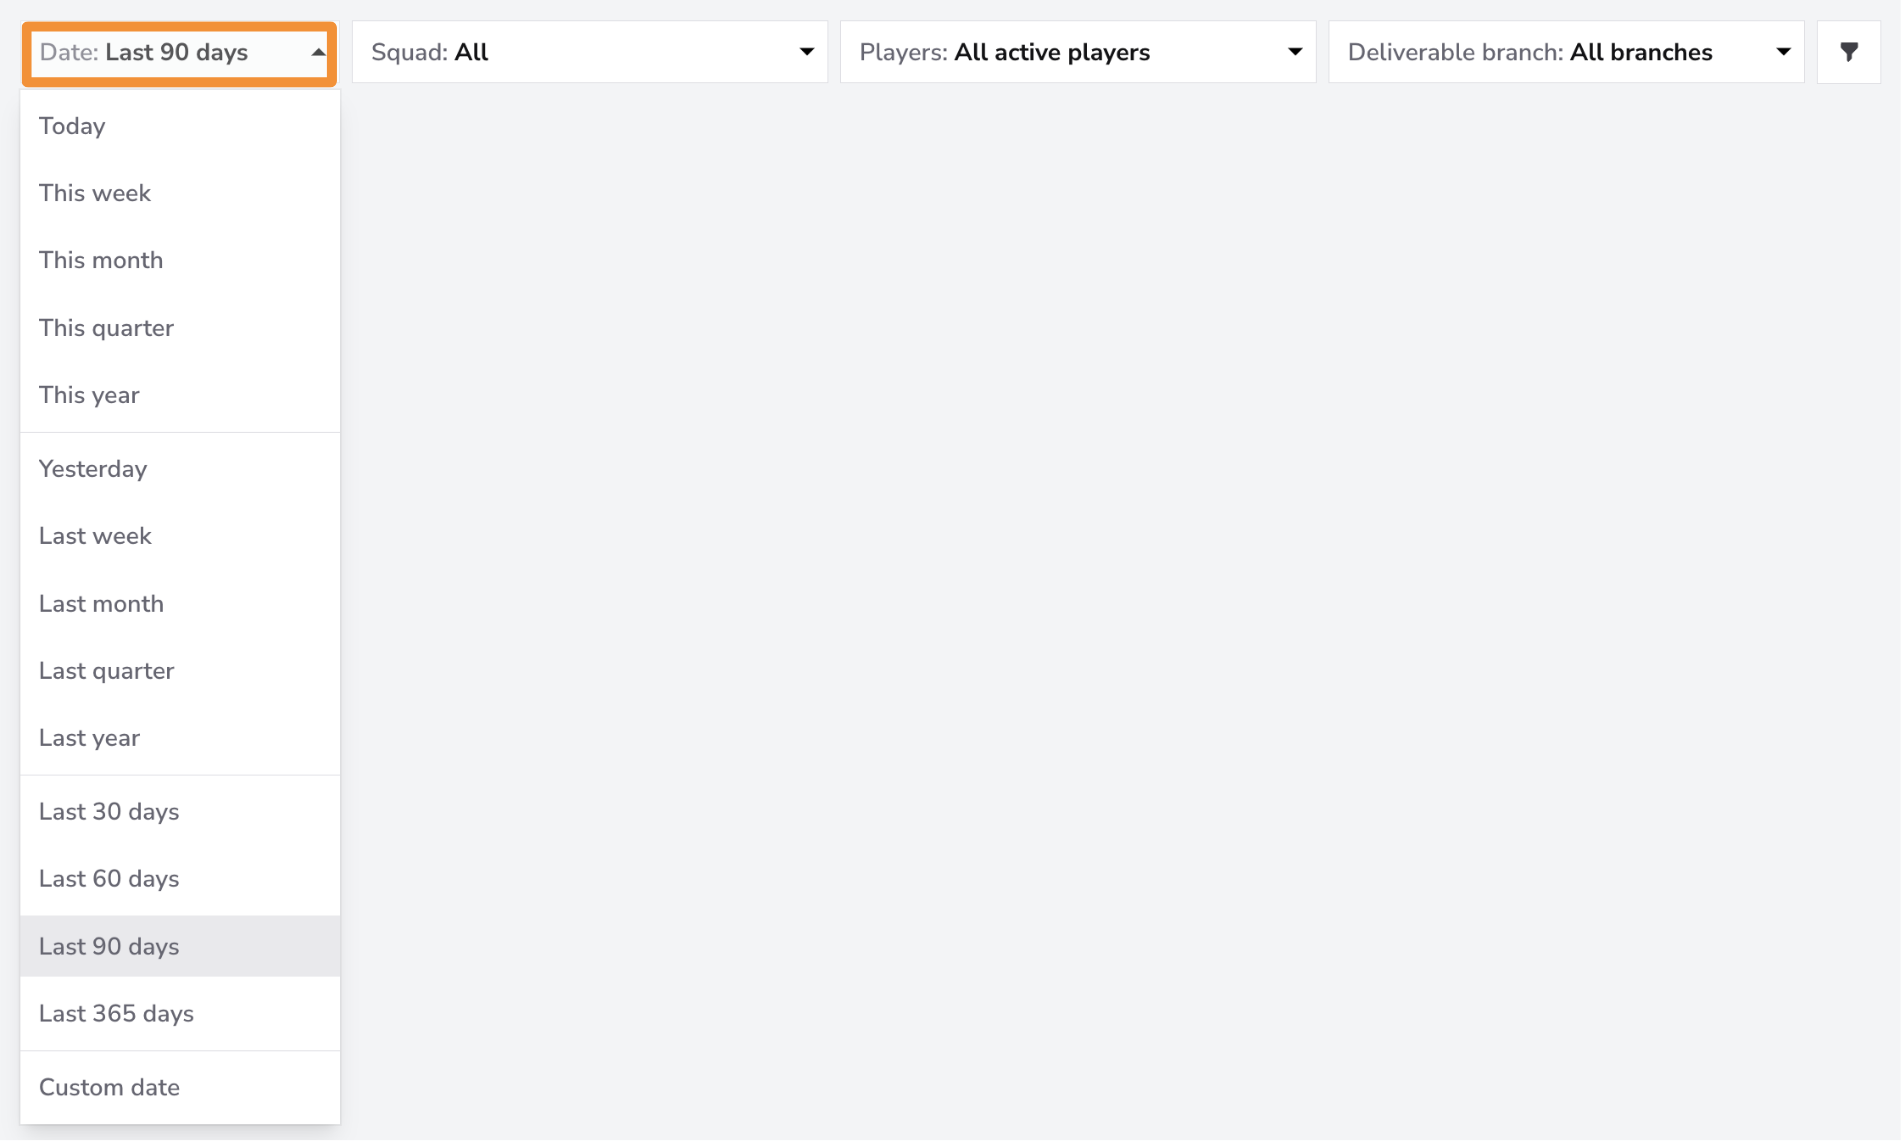
The Date Filter allows you to view data for specific time periods. You can filter for the last month, quarter, or 365 days. If you need more granular control, you can filter by a custom date range.
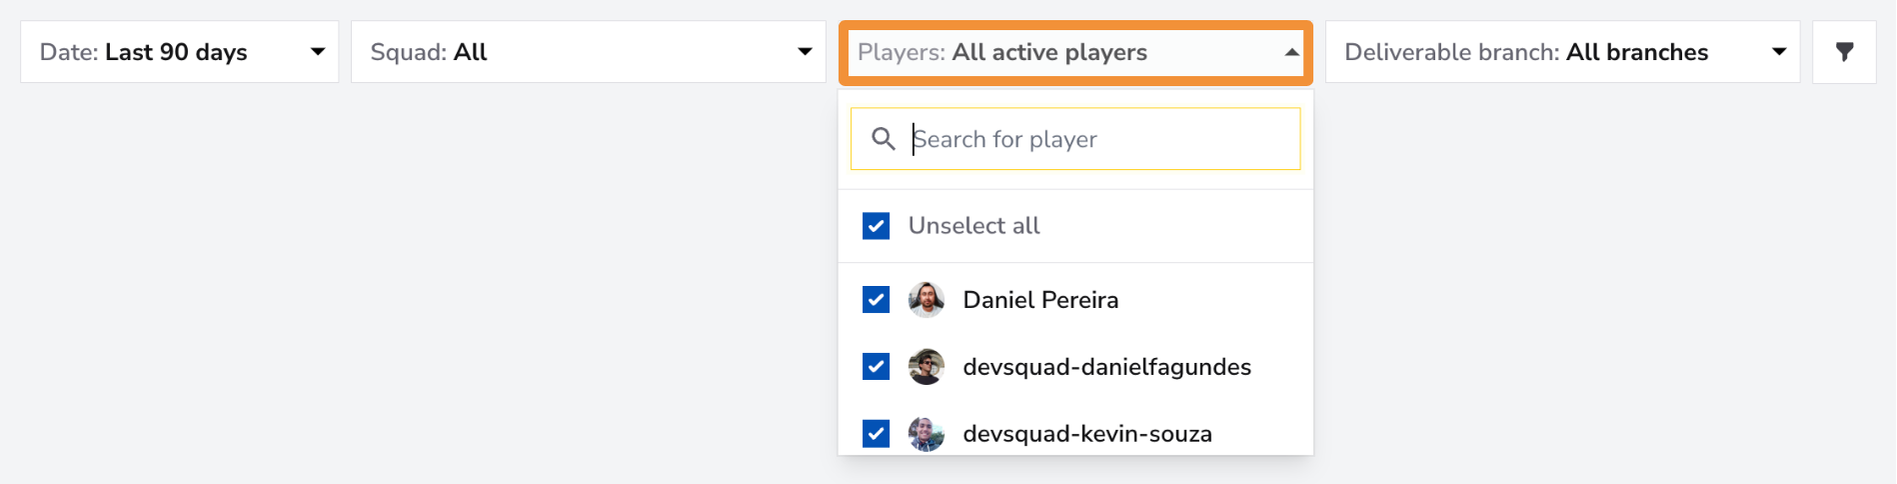
Use the Players Filter to focus on individual team members or a specific group within your squad. You can select one member for a detailed view, a group of team members if they form a sub-squad, or all team members for an overview of the entire squad's Activity Heatmap metrics.
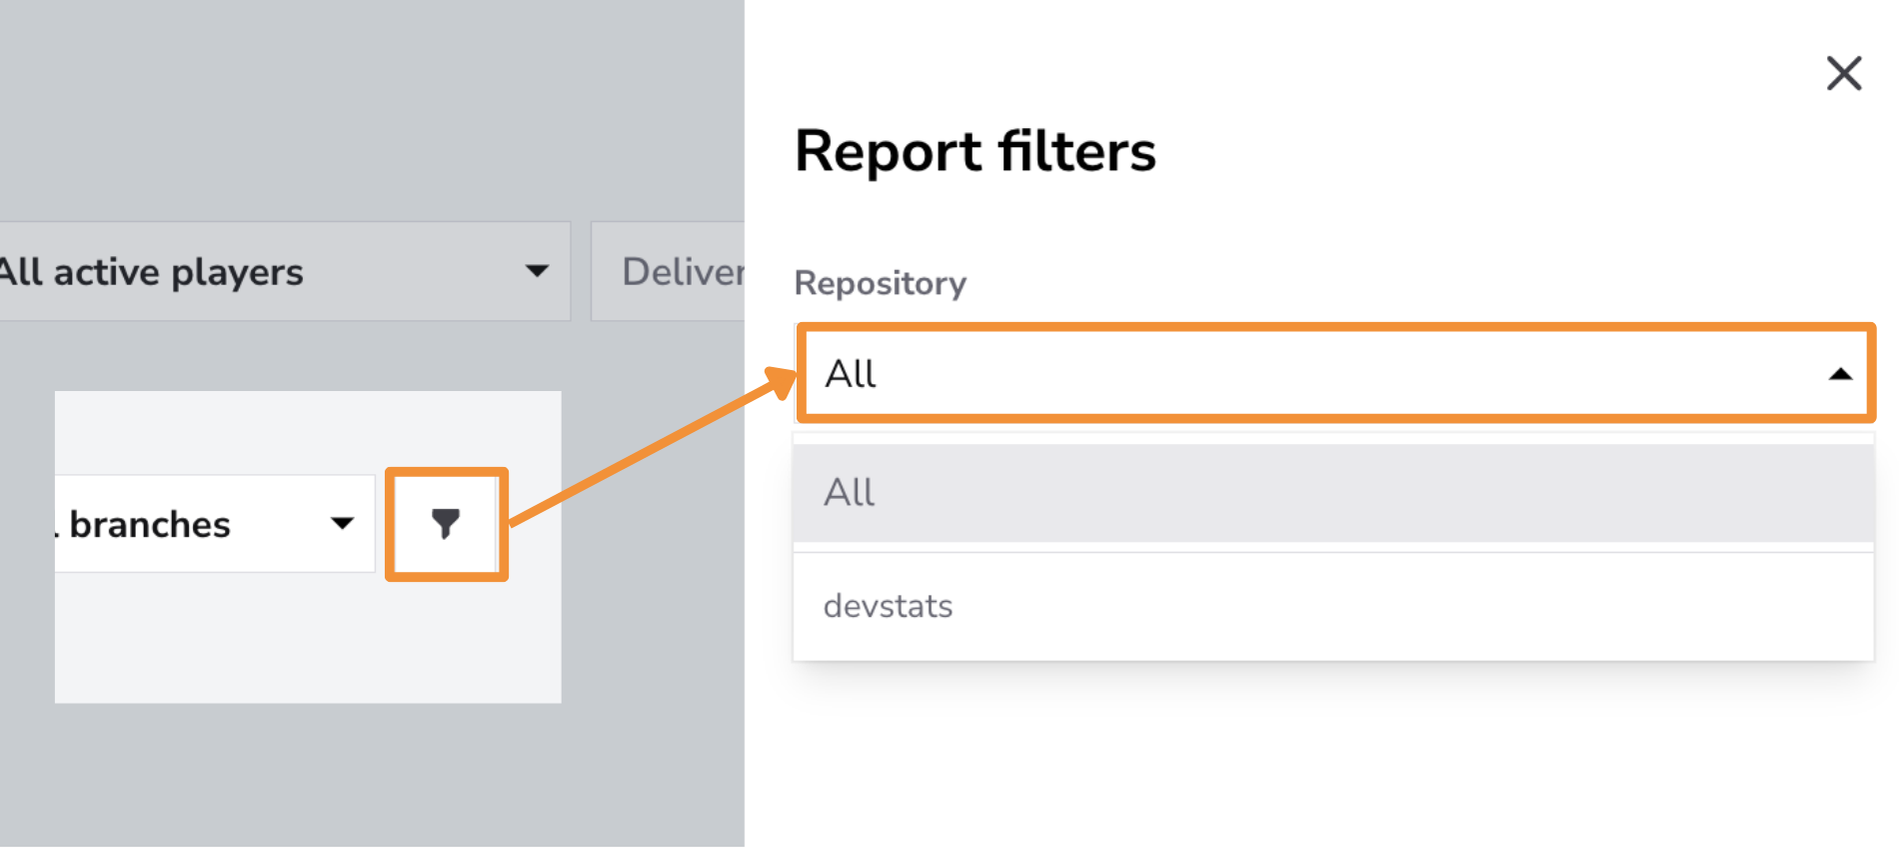
Use the Repository Filter to focus on specific repositories or view Activity metrics across all repositories. This filter is especially valuable for identifying trends and analyzing development focus in individual codebases, which is particularly helpful when managing multiple repositories.
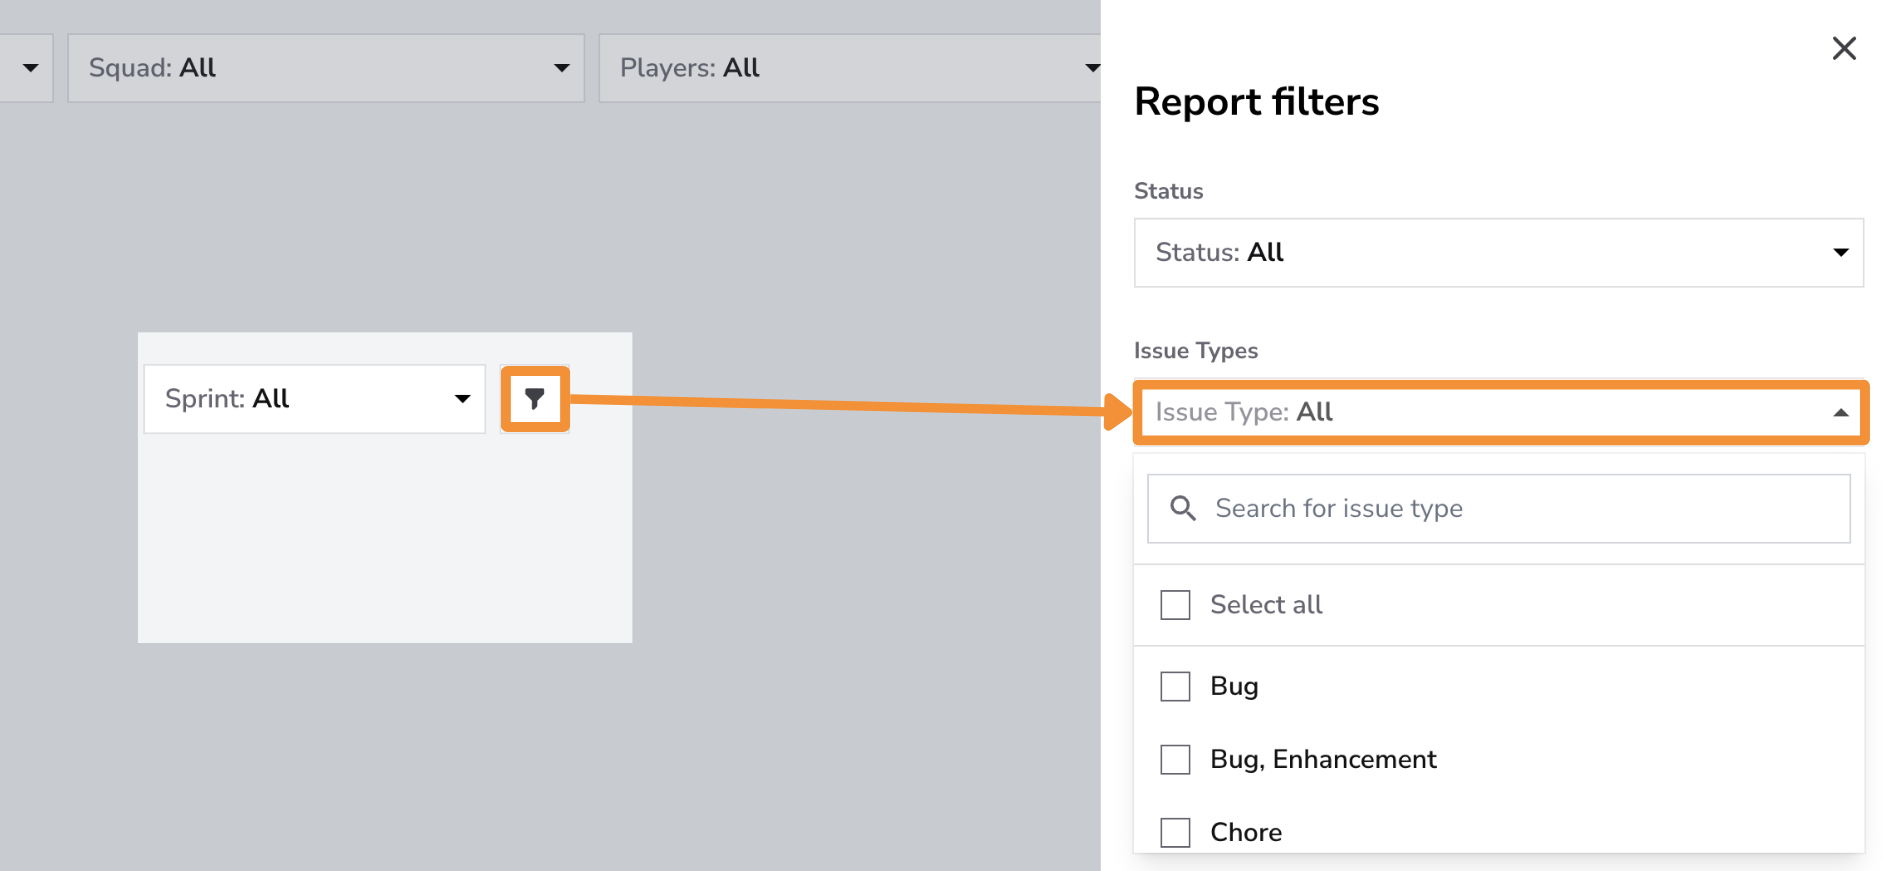
Use the Issue Type Filter to analyze activity metrics for specific types of issues, such as Features, Bugs, Enhancements, or Hotfixes. This filter allows teams to monitor how activity is distributed across different issue types, offering valuable insights into development priorities and focus areas.
Tracking activity by issue type helps identify patterns in team workflows, particularly for critical issues like bug fixes and hotfixes. This ensures that these tasks are being addressed in a timely manner to maintain productivity and product stability.
Explore Best Practices
Conclusion
The Activity Heatmap Feature is an invaluable resource for understanding your team’s work patterns and optimizing productivity. By identifying peak focus times, reducing interruptions, and aligning collaborative activities with natural lulls, this tool helps you protect your developers’ flow state and maintain consistent, high-quality output.