What is the GitHub Copilot Activity report?
The GitHub Copilot Activity report shows how people in your workspace use GitHub Copilot and how Copilot participates in pull request activity. Use it to understand adoption, compare usage patterns over time, and inspect Copilot-assisted pull request flow.
These are activity and adoption signals. They provide context for engineering analysis, but they do not by themselves prove that Copilot caused a change in productivity or delivery performance.
Open the report from DevEx > GitHub Copilot Activity.
Before you start
The report requires at least one connected GitHub Copilot organization and a completed initial synchronization. If the integration is missing or still syncing, DevStats sends you to the GitHub Copilot integration setup. See GitHub Copilot integration for setup guidance.
GitHub provides Copilot metrics only for days when an organization has at least five active Copilot license users. If the report is empty for a selected period, the organization may not have met this requirement on those days.
Tabs and access
The report opens on the User tab. Workspace owners and admins can also open the Organization tab. Users with permission to view Settings can open Edit Integration directly from the report.
Both tabs include a date filter. The User tab also includes a player filter. The Organization tab includes an organization filter when more than one Copilot organization is connected.
Charts can also provide their own period and visualization controls. Changing a selected metric card updates the related chart.
User tab
The User tab focuses on adoption and activity by player.
Summary metrics
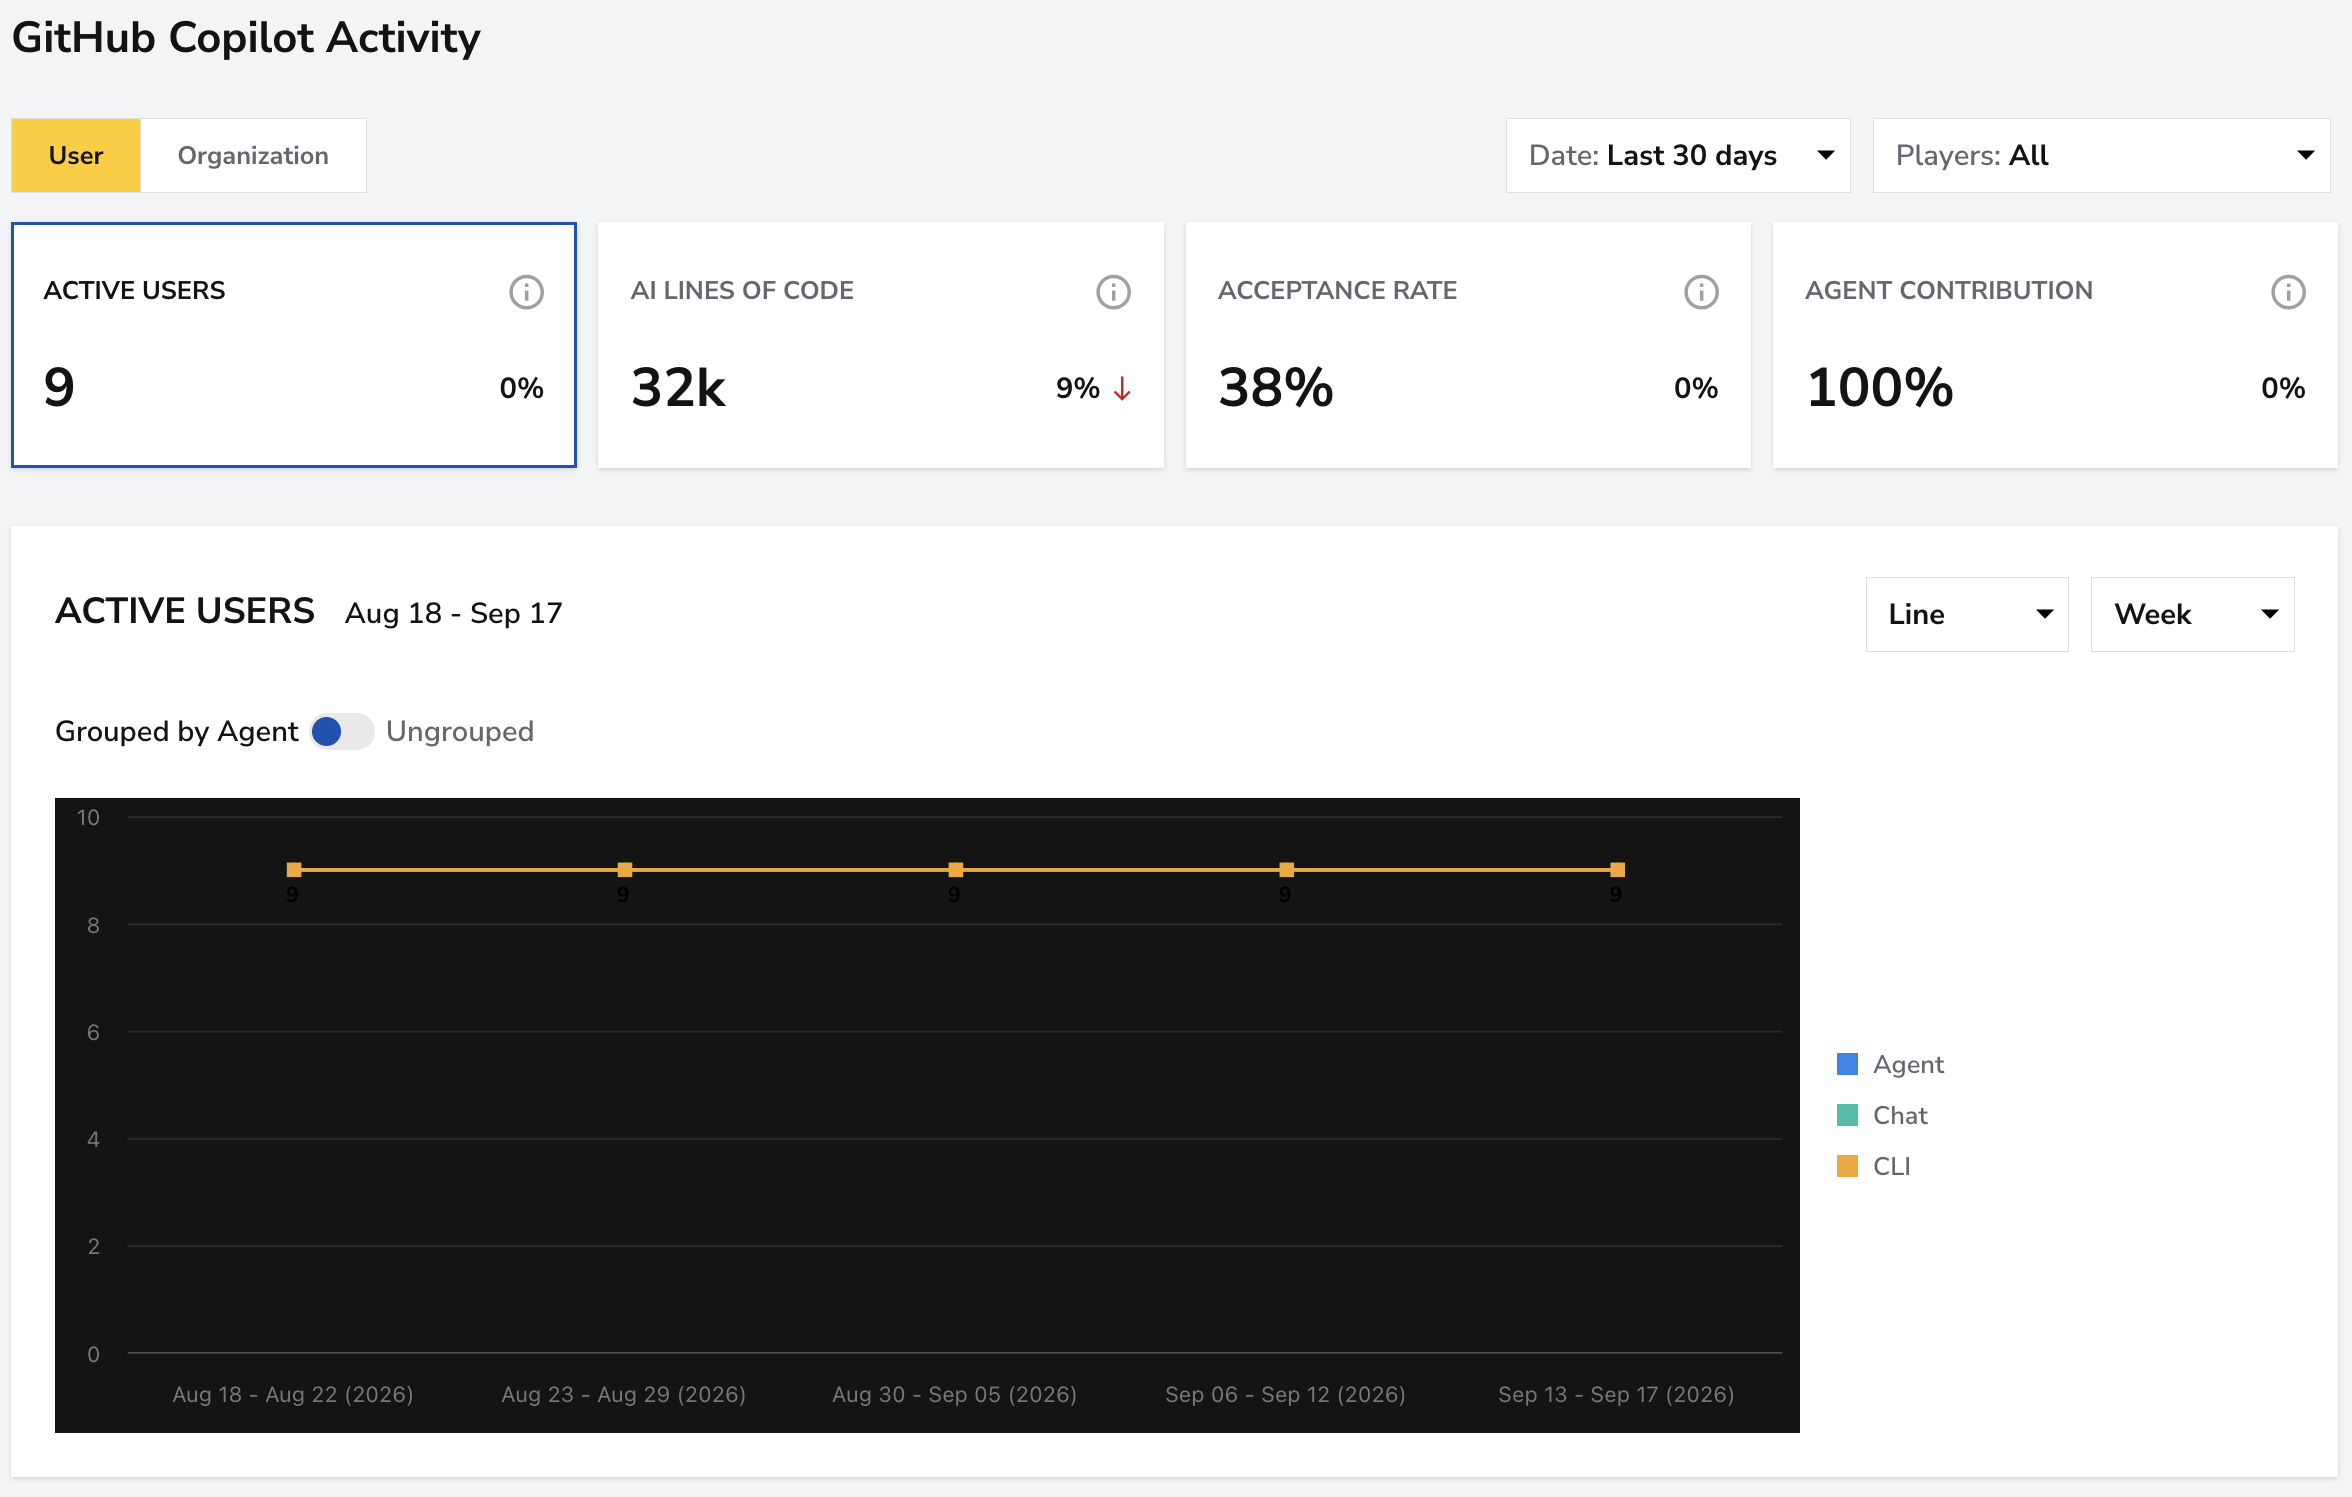
- Active Users: distinct users who used Copilot at least once in the selected period. Its chart can show all active users together or group them by Agent, Chat, and CLI activity.
- AI Lines of Code: lines added and deleted with Copilot's help during the selected period.
- Acceptance Rate: percentage of generated code suggestions that users accepted.
- Agent Contribution: percentage of active users who used Copilot's coding agent.
Adoption Cohorts
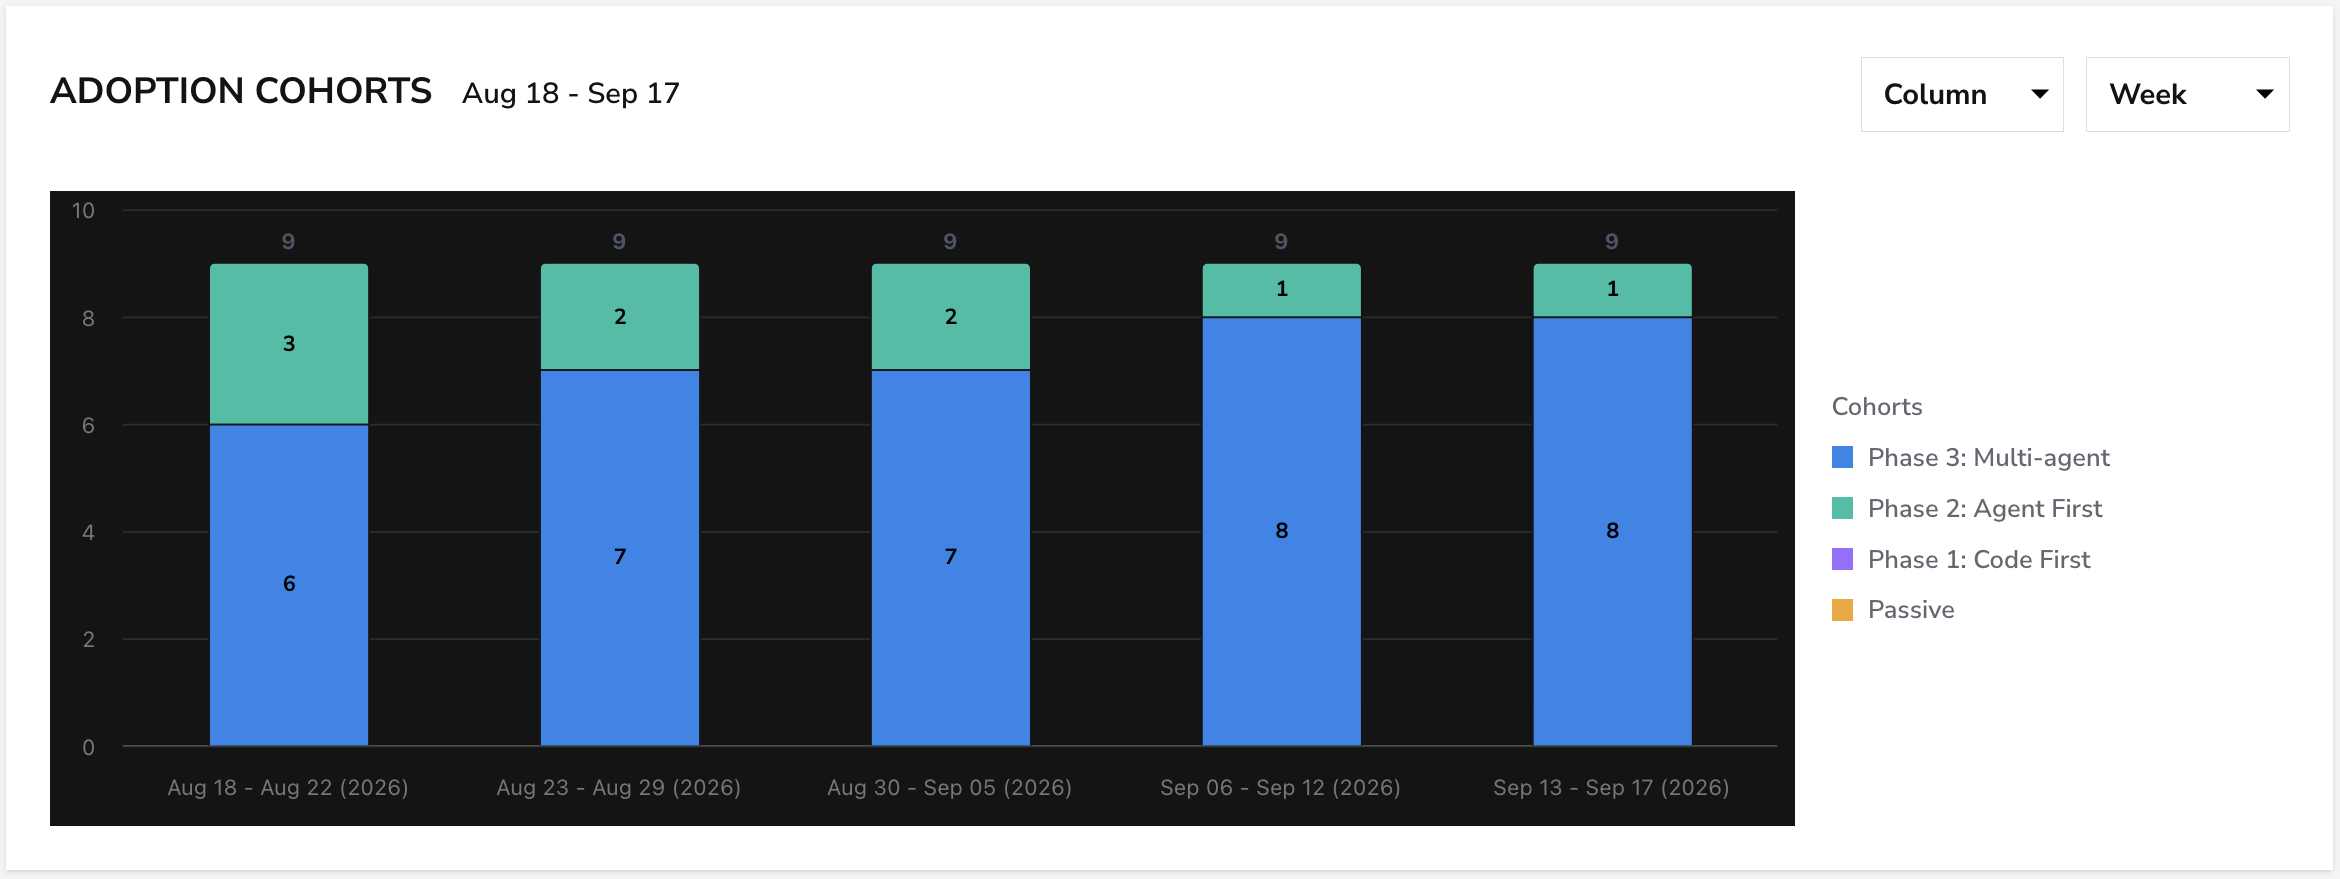
The Adoption Cohorts chart tracks the latest adoption phase recorded for each player in each period:
- Passive
- Phase 1: Code First
- Phase 2: Agent First
- Phase 3: Multi-agent
Use the chart to observe how the distribution of players across GitHub's Copilot adoption phases changes over time.
Copilot CLI
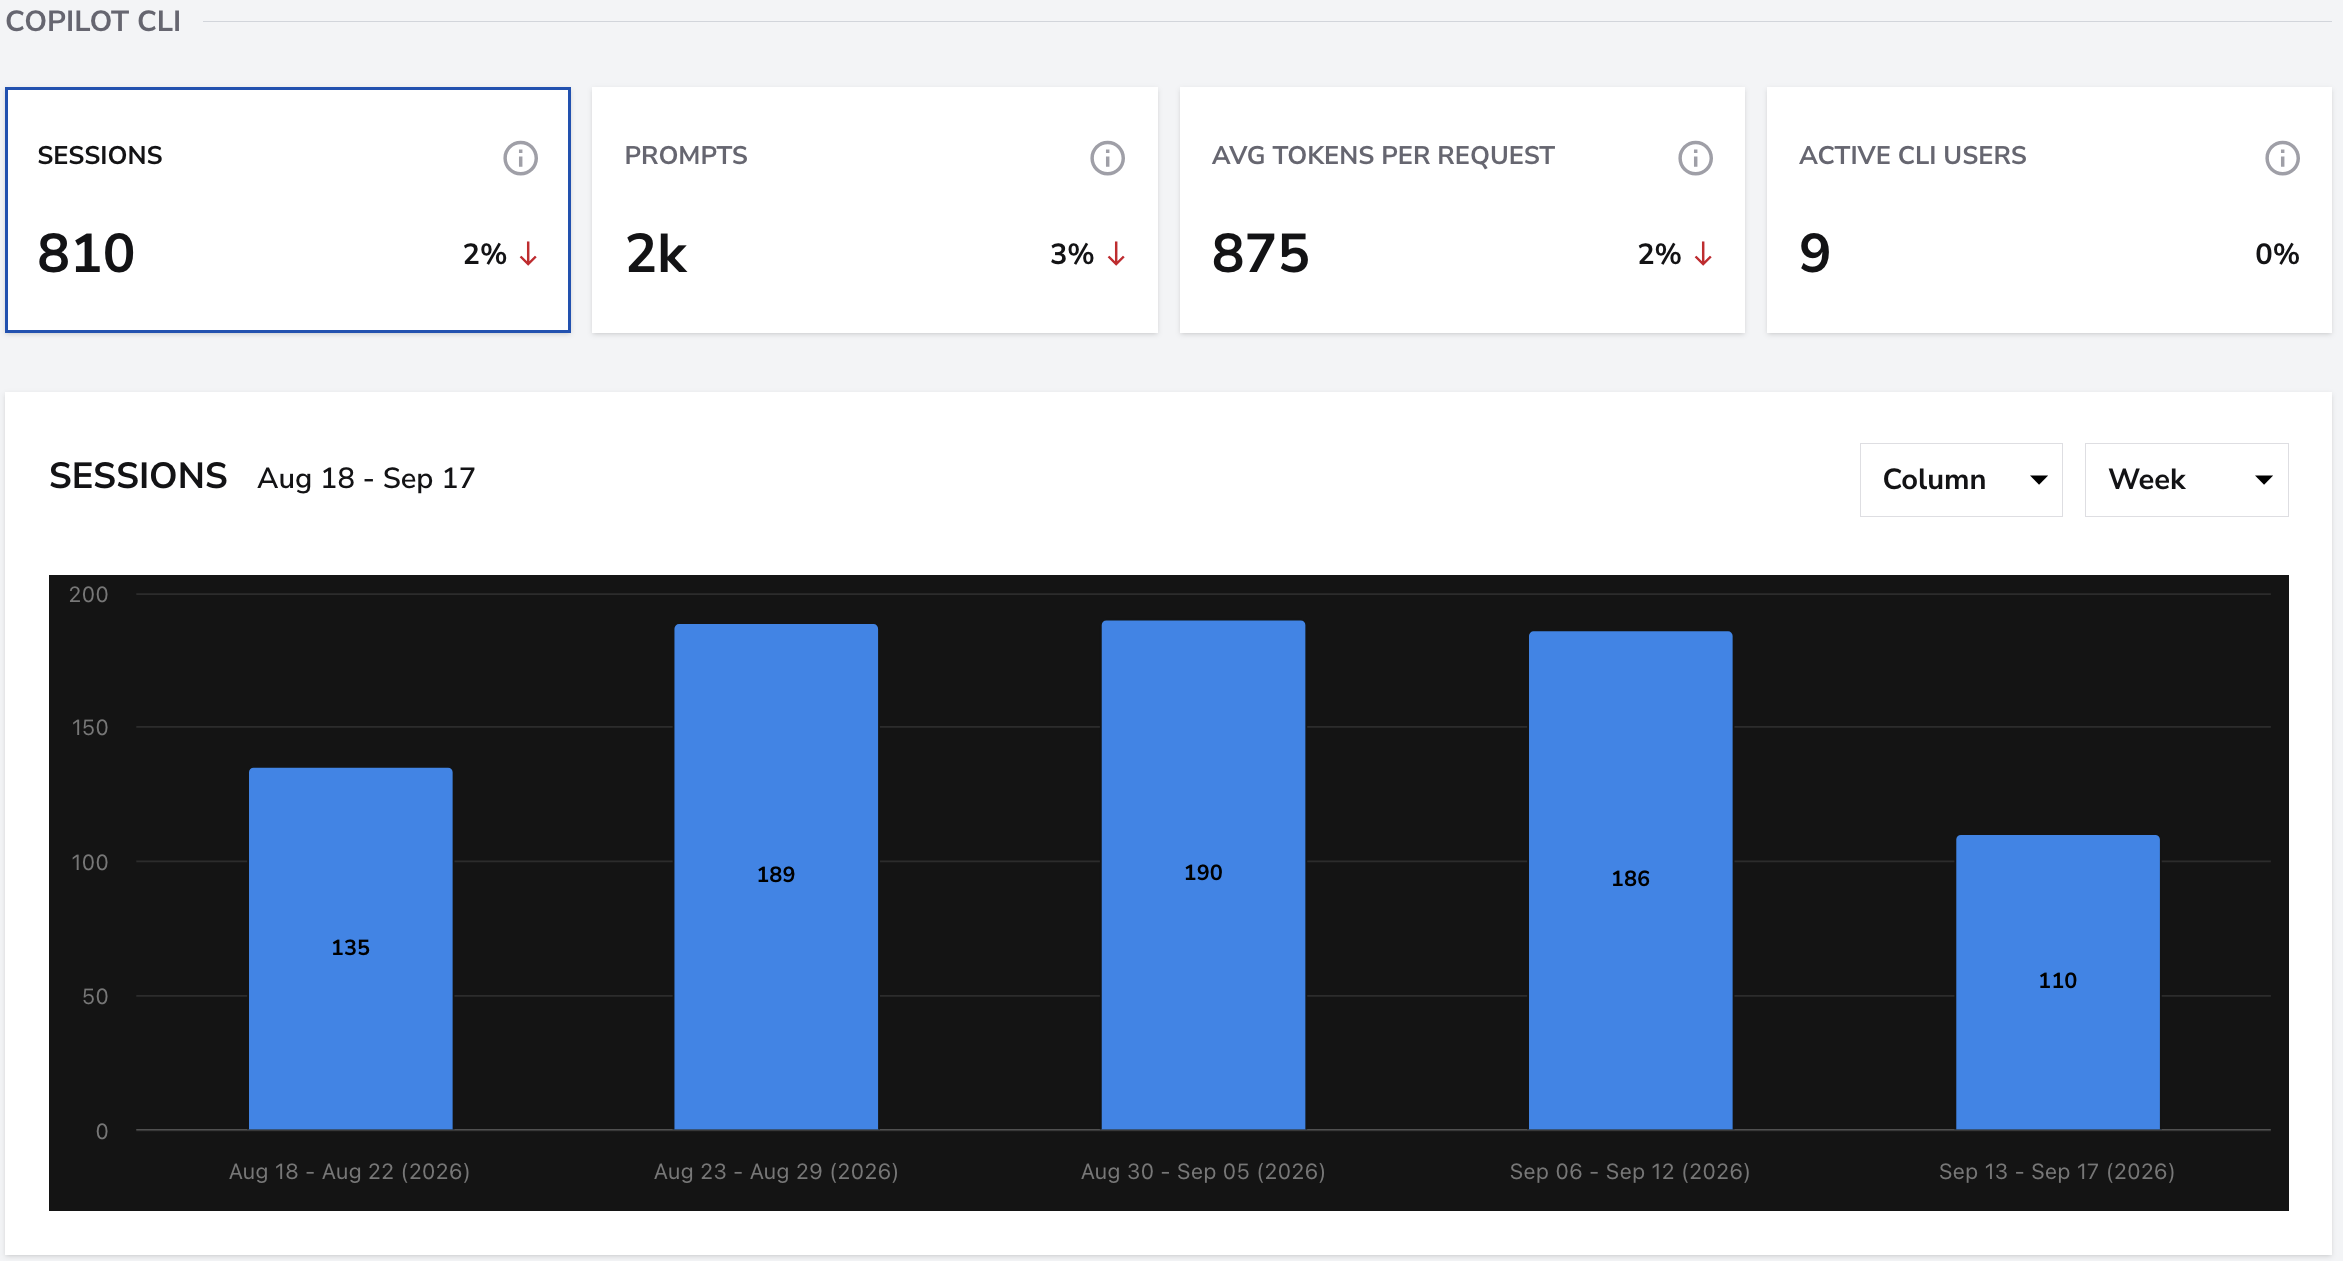
The Copilot CLI section contains four selectable metrics:
- Sessions: Copilot CLI sessions started.
- Prompts: prompts sent to Copilot CLI.
- Average Tokens per Request: average prompt and output tokens per CLI request.
- Active CLI Users: distinct users who started at least one CLI session.
Players table
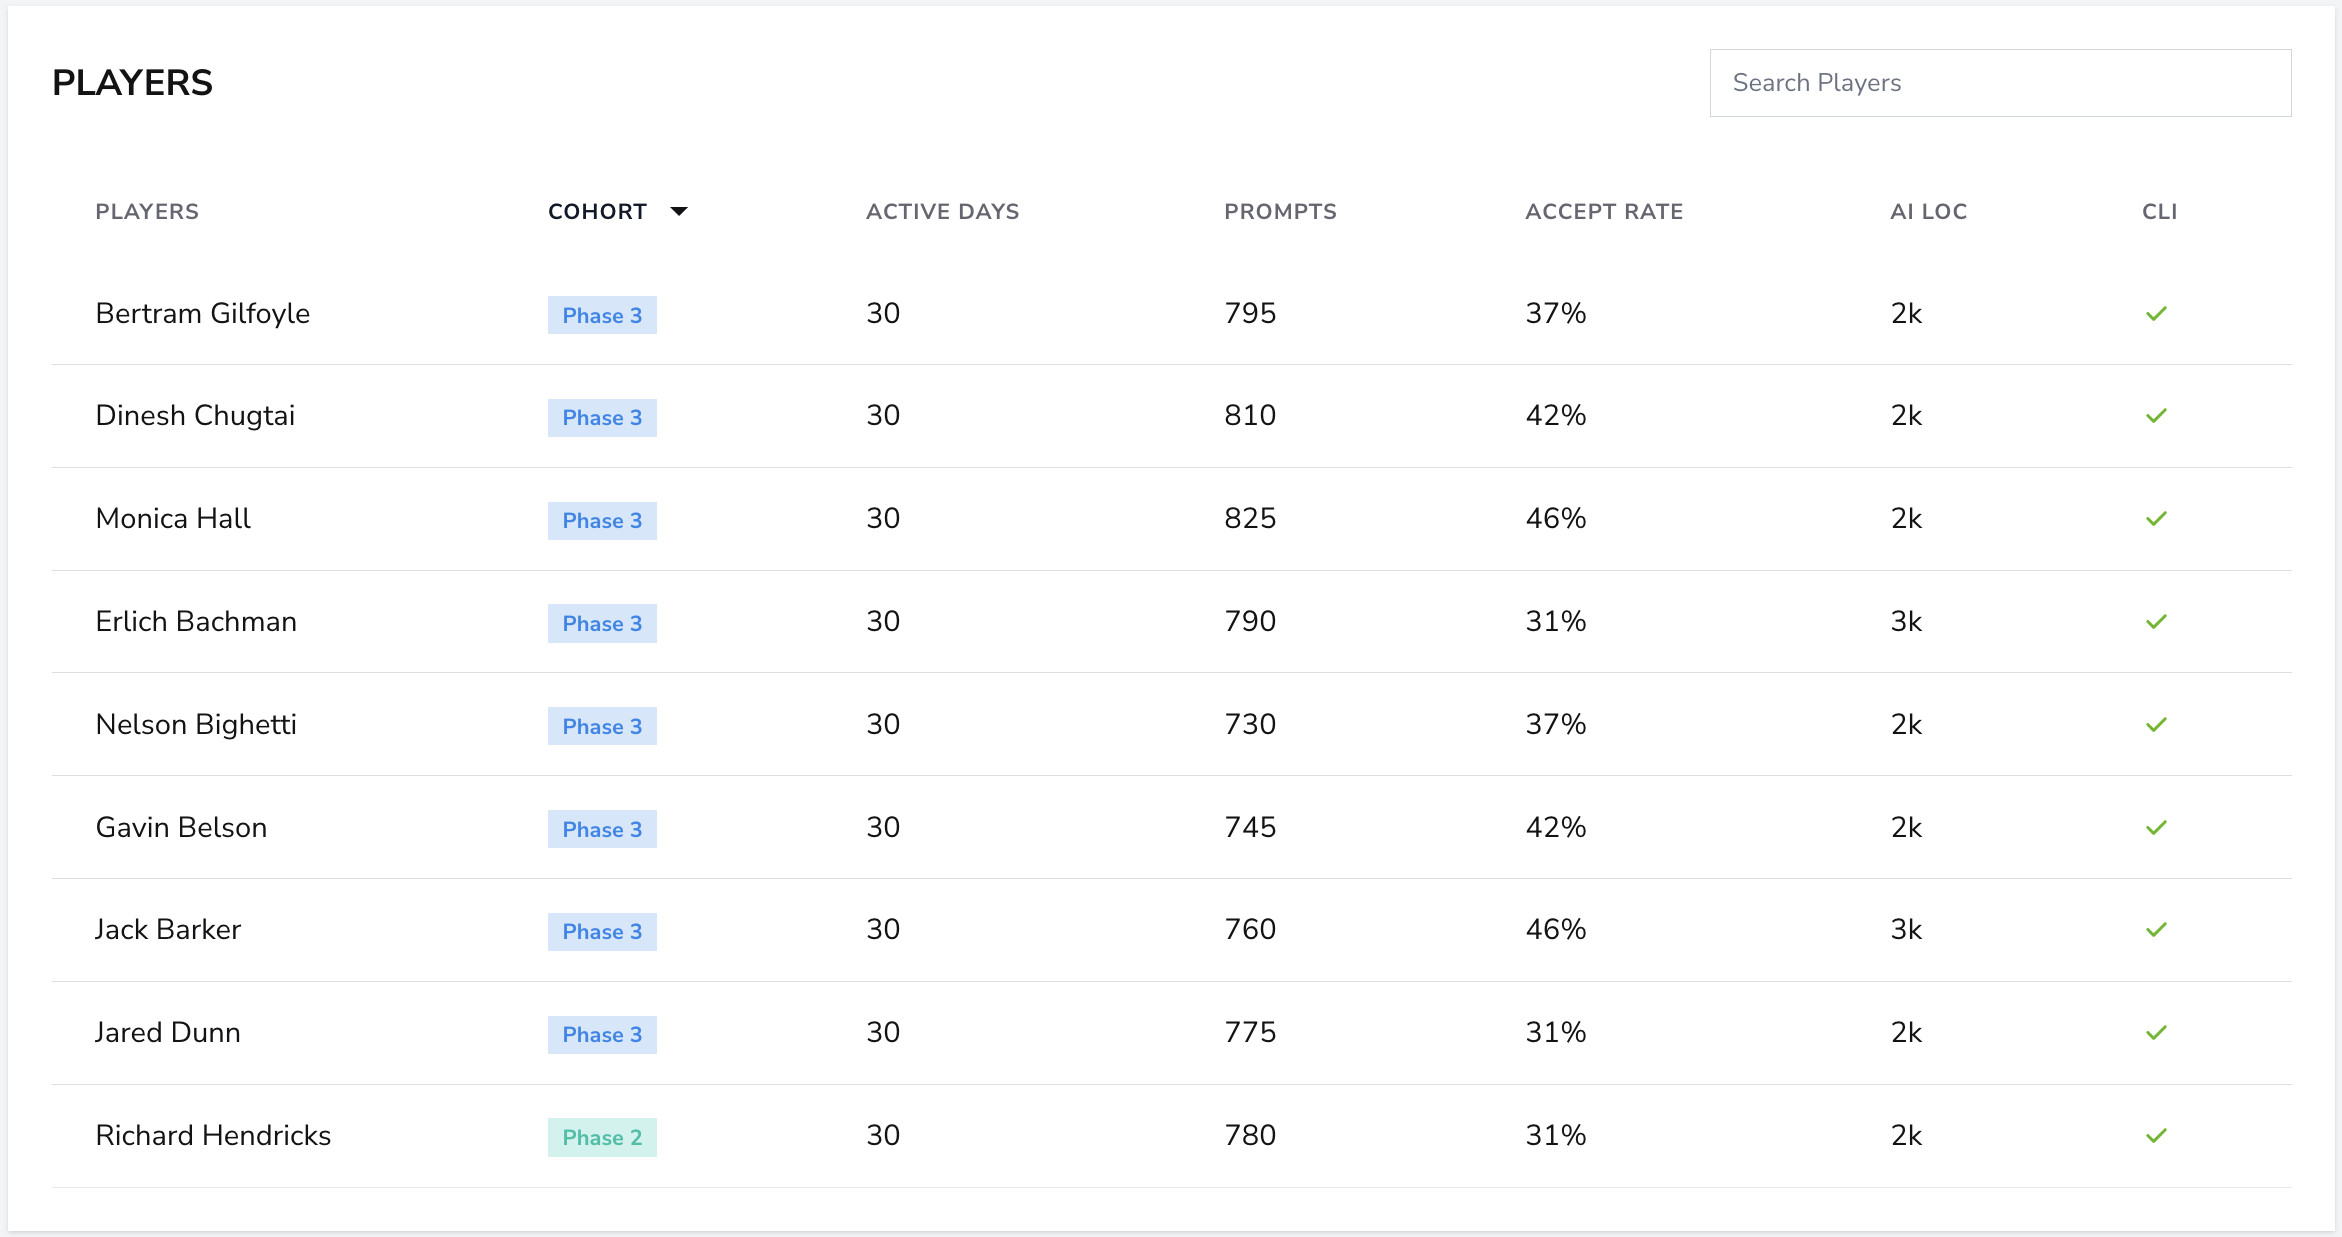
The Players table provides a per-player breakdown for the selected period. It includes the player's adoption cohort, active days, prompts, acceptance rate, AI lines of code, and whether the player used Copilot CLI. Use search and column sorting to inspect the table.
Organization tab
The Organization tab is available to workspace owners and admins and focuses on organization-wide adoption and pull request activity.
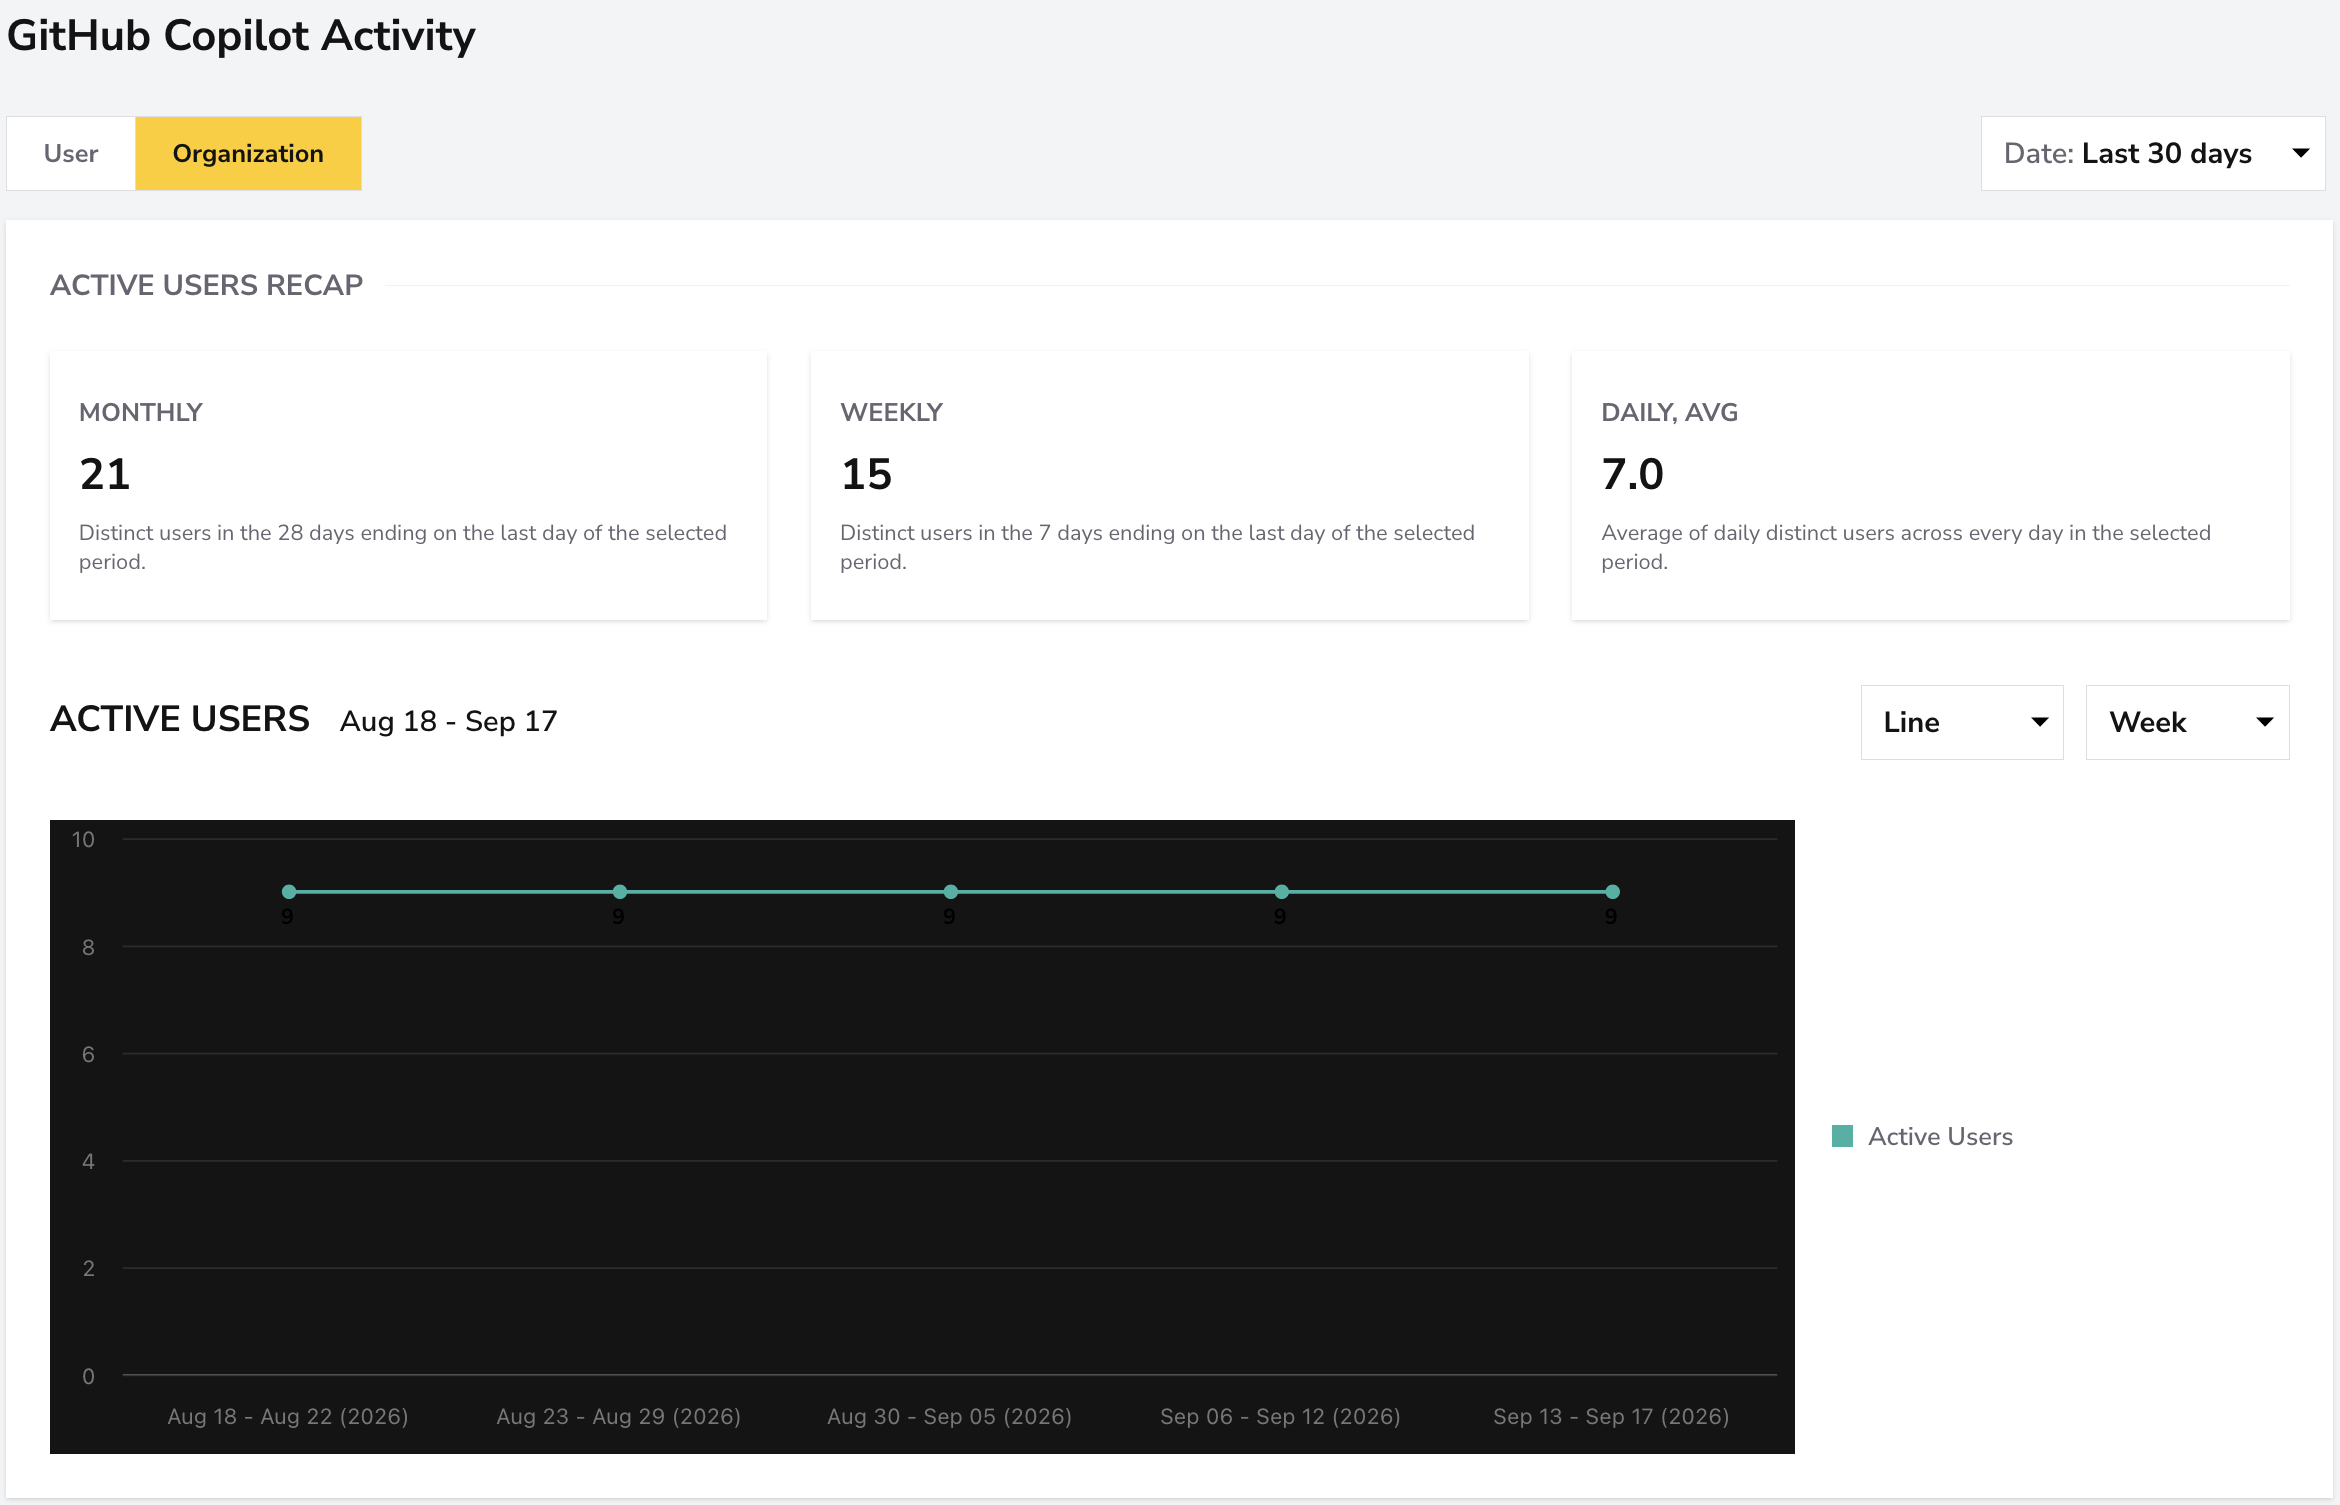
Active Users Recap
- Monthly: distinct users in the 28 days ending on the last day of the selected period.
- Weekly: distinct users in the seven days ending on the last day of the selected period.
- Daily, AVG: average number of distinct daily users across every day in the selected period.
The Active Users chart shows how organization-level adoption changes over time.
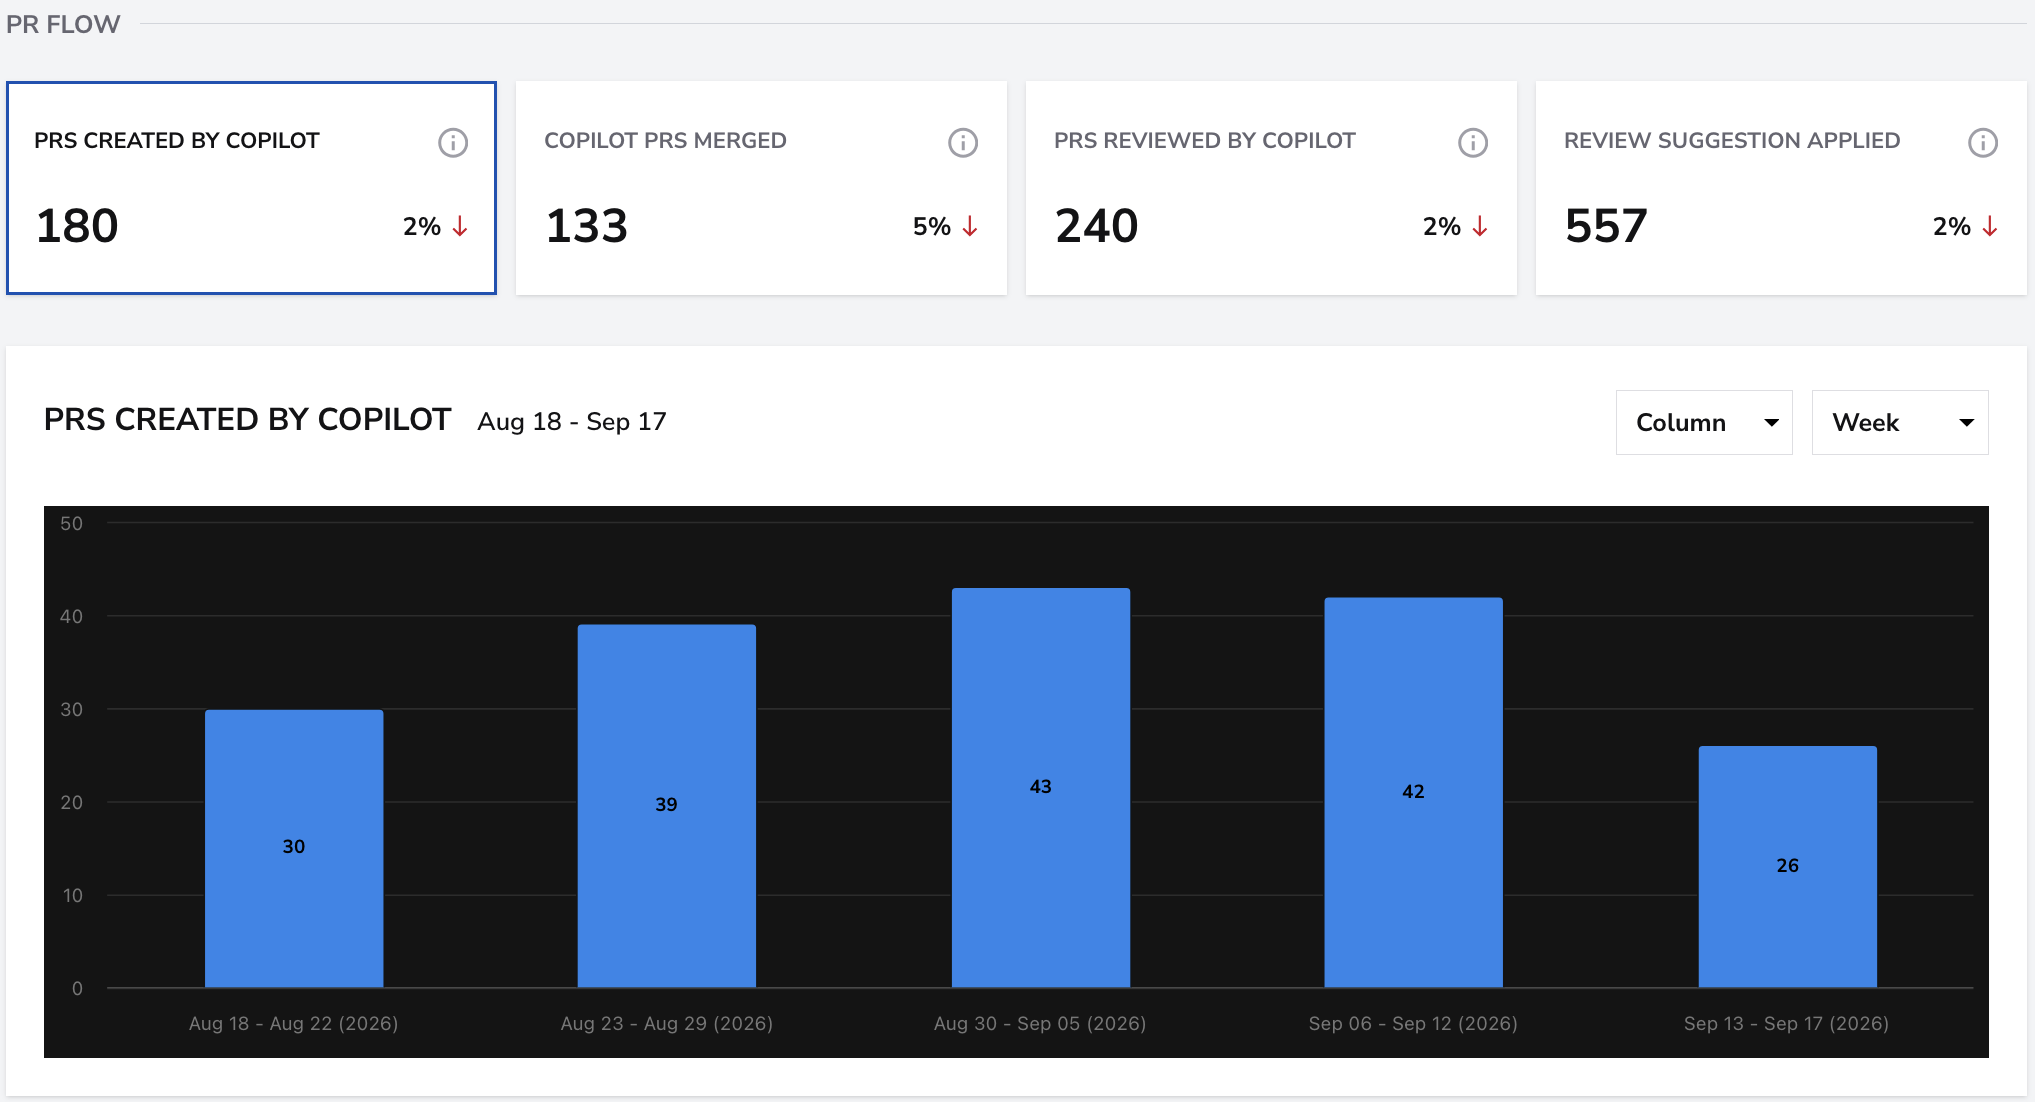
PR Flow
- PRs Created by Copilot: pull requests created by Copilot's coding agent.
- Copilot PRs Merged: pull requests created by Copilot's coding agent that were merged.
- PRs Reviewed by Copilot: pull requests reviewed by Copilot.
- Review Suggestions Applied: Copilot code review suggestions applied by users.
Select a card to display that metric in the PR Flow chart.
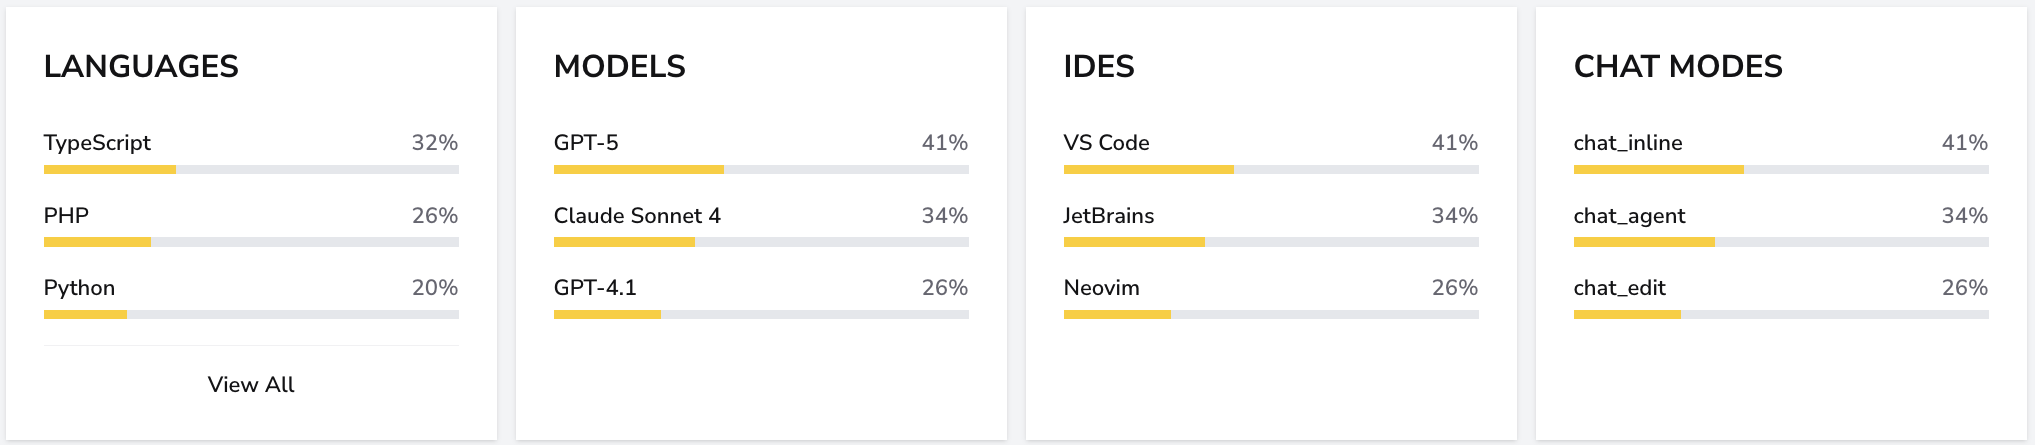
Usage breakdowns
The Languages, Models, IDEs, and Chat Modes cards show the percentage distribution for each dimension. Select View All when a card contains more items than its initial list displays.
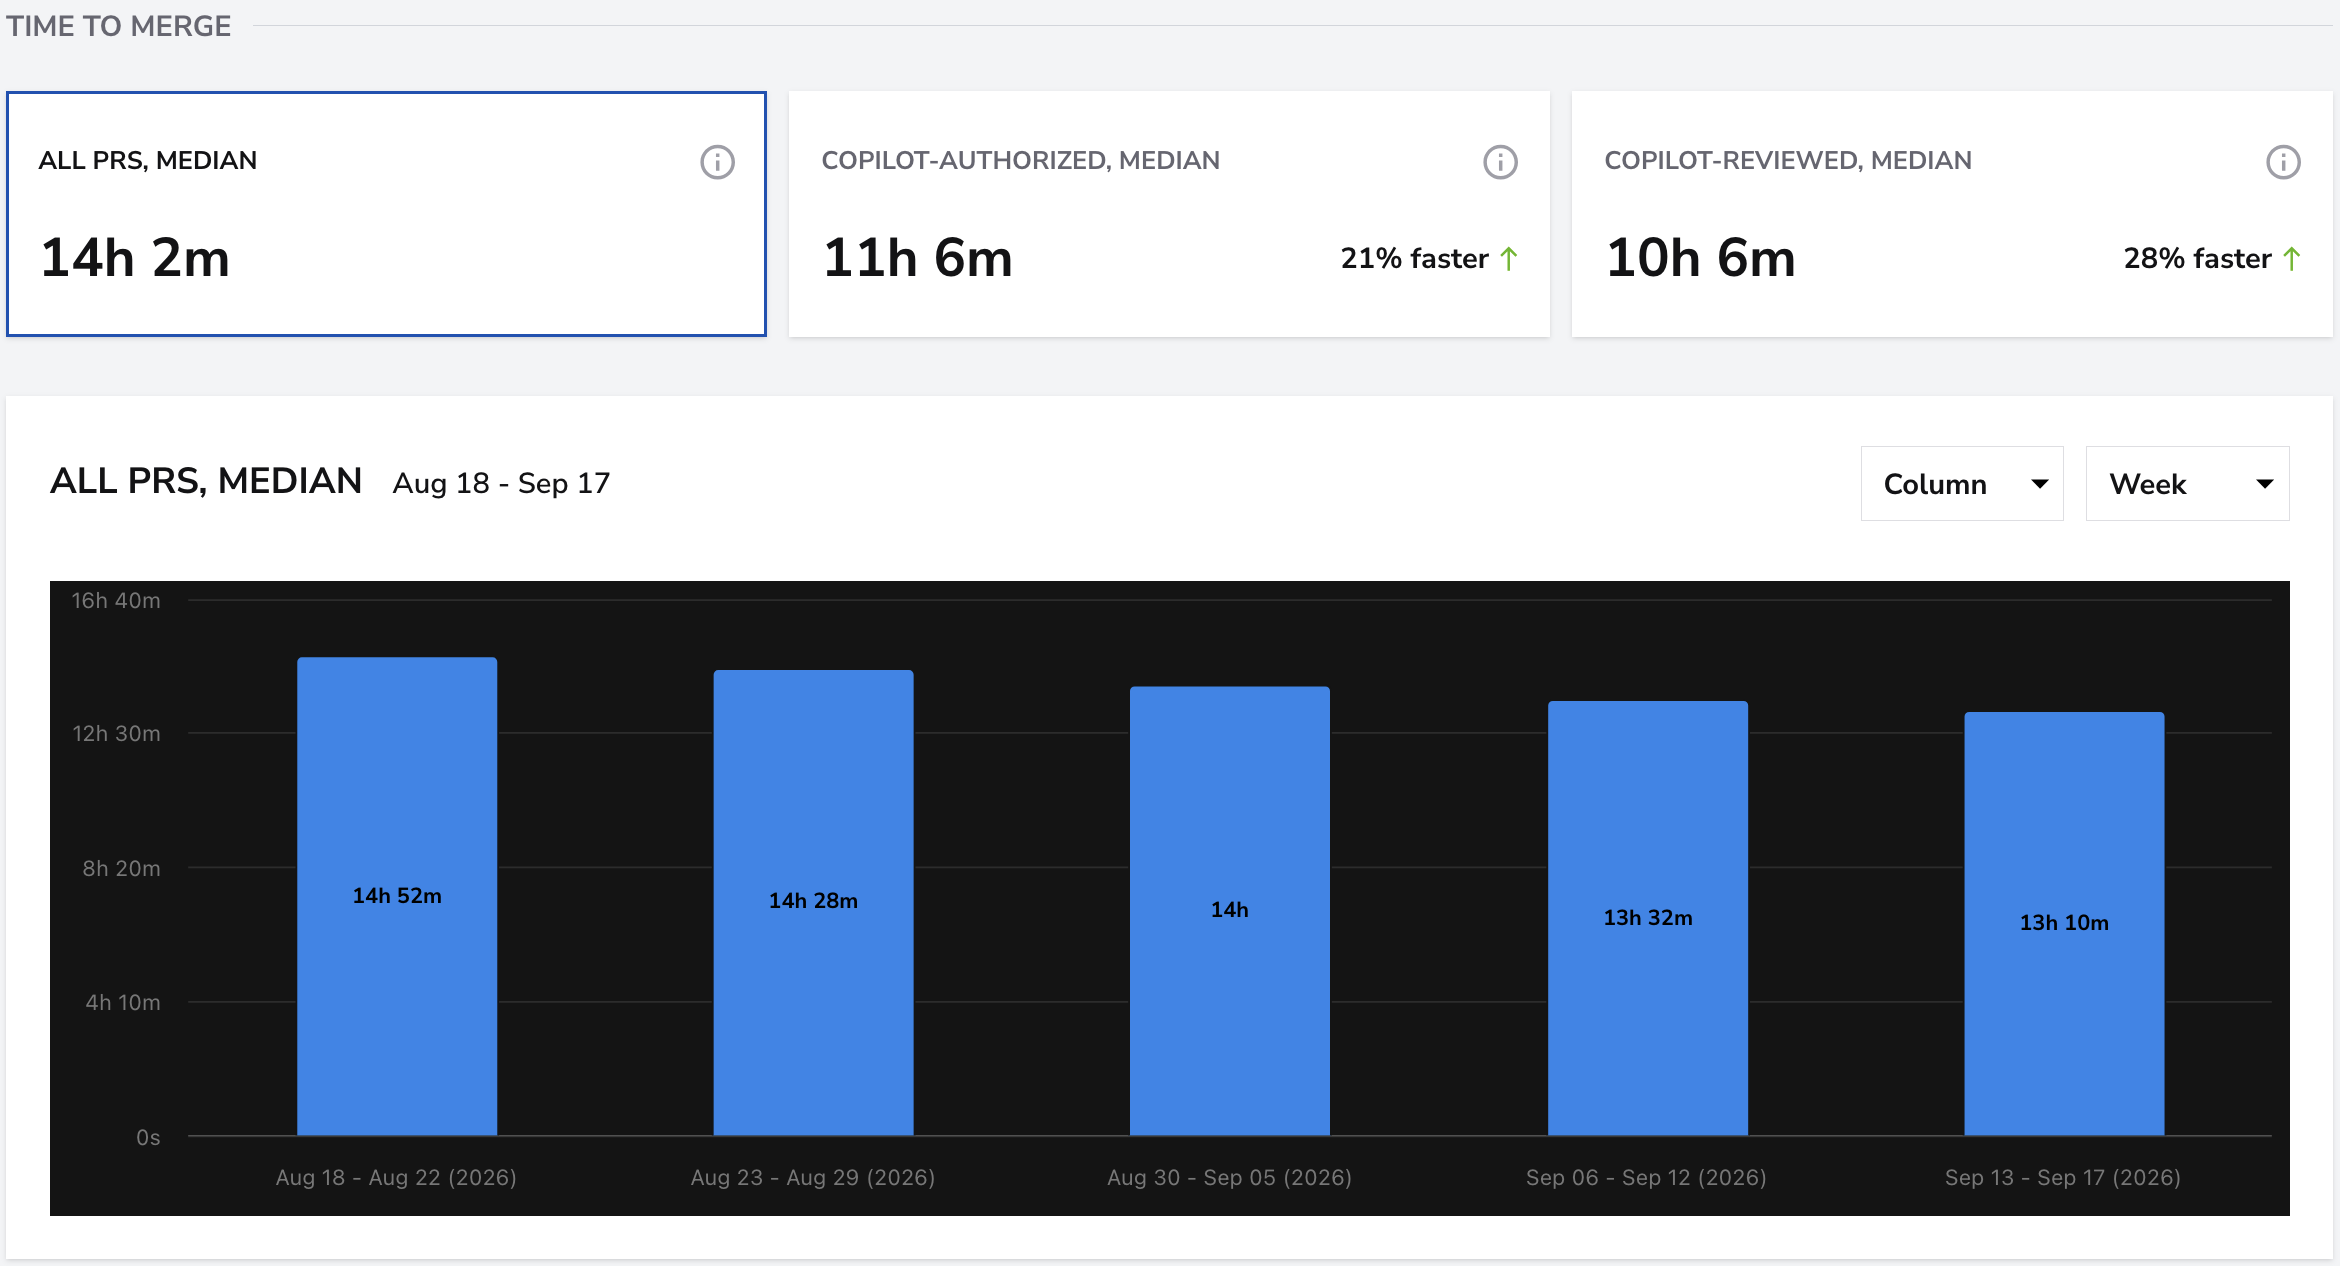
Time to Merge
- All PRs, Median: median time to merge across all pull requests.
- Copilot-Authorized, Median: the interface label for the median time to merge of pull requests authored by Copilot's coding agent, compared with all pull requests.
- Copilot-Reviewed, Median: median time to merge of pull requests reviewed by Copilot, compared with all pull requests.
Select a card to update the Time to Merge chart.
Additional organization charts
- Copilot PR Activity: compares pull requests created by the coding agent with pull requests reviewed by Copilot.
- Code Review Adoption: compares active and passive Copilot code review usage over time.
- Review Suggestions by Type: shows how many suggestions of each type were applied out of the total generated.
How to interpret the report
Use changes in Copilot activity as a starting point for investigation. Read adoption alongside delivery metrics such as PR Cycle Time, Code Review, Throughput, and quality or stability indicators. A higher activity count means that Copilot was used more often; it does not necessarily mean that delivery became faster or better.