What is the Sprint Progress Summary Report?
The Sprint Progress Summary Report provides a high-level overview of your team's sprint activity, helping you monitor progress and manage workloads effectively. With metrics like Committed,Added Late,Capacity, and Days Left, this report ensures that you can track your sprint's health and make informed decisions to optimize team performance. It’s essential for keeping sprints on track and avoiding overcommitment or last-minute surprises.
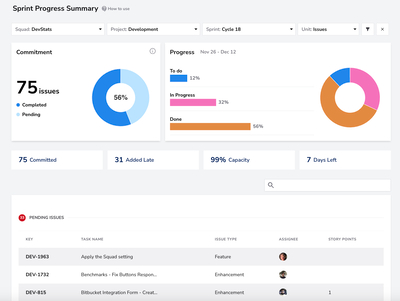
The Sprint Progress Summary interface includes the following elements:
- Commitment Overview (Left Chart):Commitment Breakdown: Displays the total number of issues committed to the sprint. The pie chart shows the percentage of pending (light blue) versus completed (blue) issues.
- Progress Distribution (Right Chart):Progress Status: A donut chart breaks down tasks into three categories: To Do (Blue): Tasks yet to be started.In Progress (Pink): Tasks currently being worked on.Done (Orange): Tasks fully completed during the sprint.This visualization highlights the current state of all tasks within the sprint and helps identify which stage requires more focus.
- Pending Issues Table: This table provides a detailed breakdown of all tasks that are still pending within the sprint.
Metrics
Filters
The Squad filter focuses the report on a specific squad. It allows managers to dive deeper into the sprint summary for individual squads, offering targeted insights into team performance and workload. Use this filter to analyze each squad's progress and identify potential issues or overcommitments.

The Project filter narrows the report down to a specific project, providing insights into sprint progress for that particular initiative. Use this filter to focus on a project's performance, ensuring alignment with goals and identifying any potential delays or resource challenges within the context of that project.

The Sprint filter allows you to narrow down the report data to a specific sprint. By selecting an ongoing sprint from the filter, you can focus only on the metrics and progress related to that sprint, making it easier to track and analyze the team’s performance during the selected period.

The Unit filter customizes the report based on how you want to measure progress. Choose between "Issues" to count the total number of tasks or "Story Points" to focus on the estimated effort. Use this filter to adjust the granularity of the report and better align it with your team's tracking preferences and planning methodology.

Conclusion
The Sprint Progress Summary Report provides actionable insights into your team's sprint performance. By monitoring metrics like Committed,Added Late,Capacity, and Days Left, you can ensure sprints stay on track, and your team avoids overcommitment or unnecessary stress. Use the filters to focus on specific squads, projects, or sprints and tailor the report to your team’s needs.