What is the Issue Cycle Time Feature?
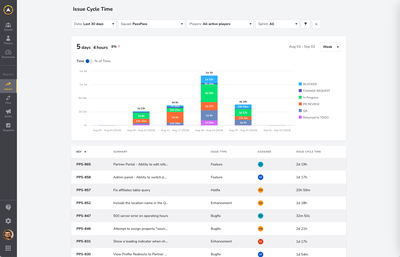
The Issue Cycle Time Dashboard provides insights into the time tasks spend in active stages, from the moment they enter "In Progress" until they are marked as "Done." By visualizing each stage of work, this dashboard enables teams to make data-driven decisions to streamline workflows, minimize delays, and accelerate overall delivery.
Metrics
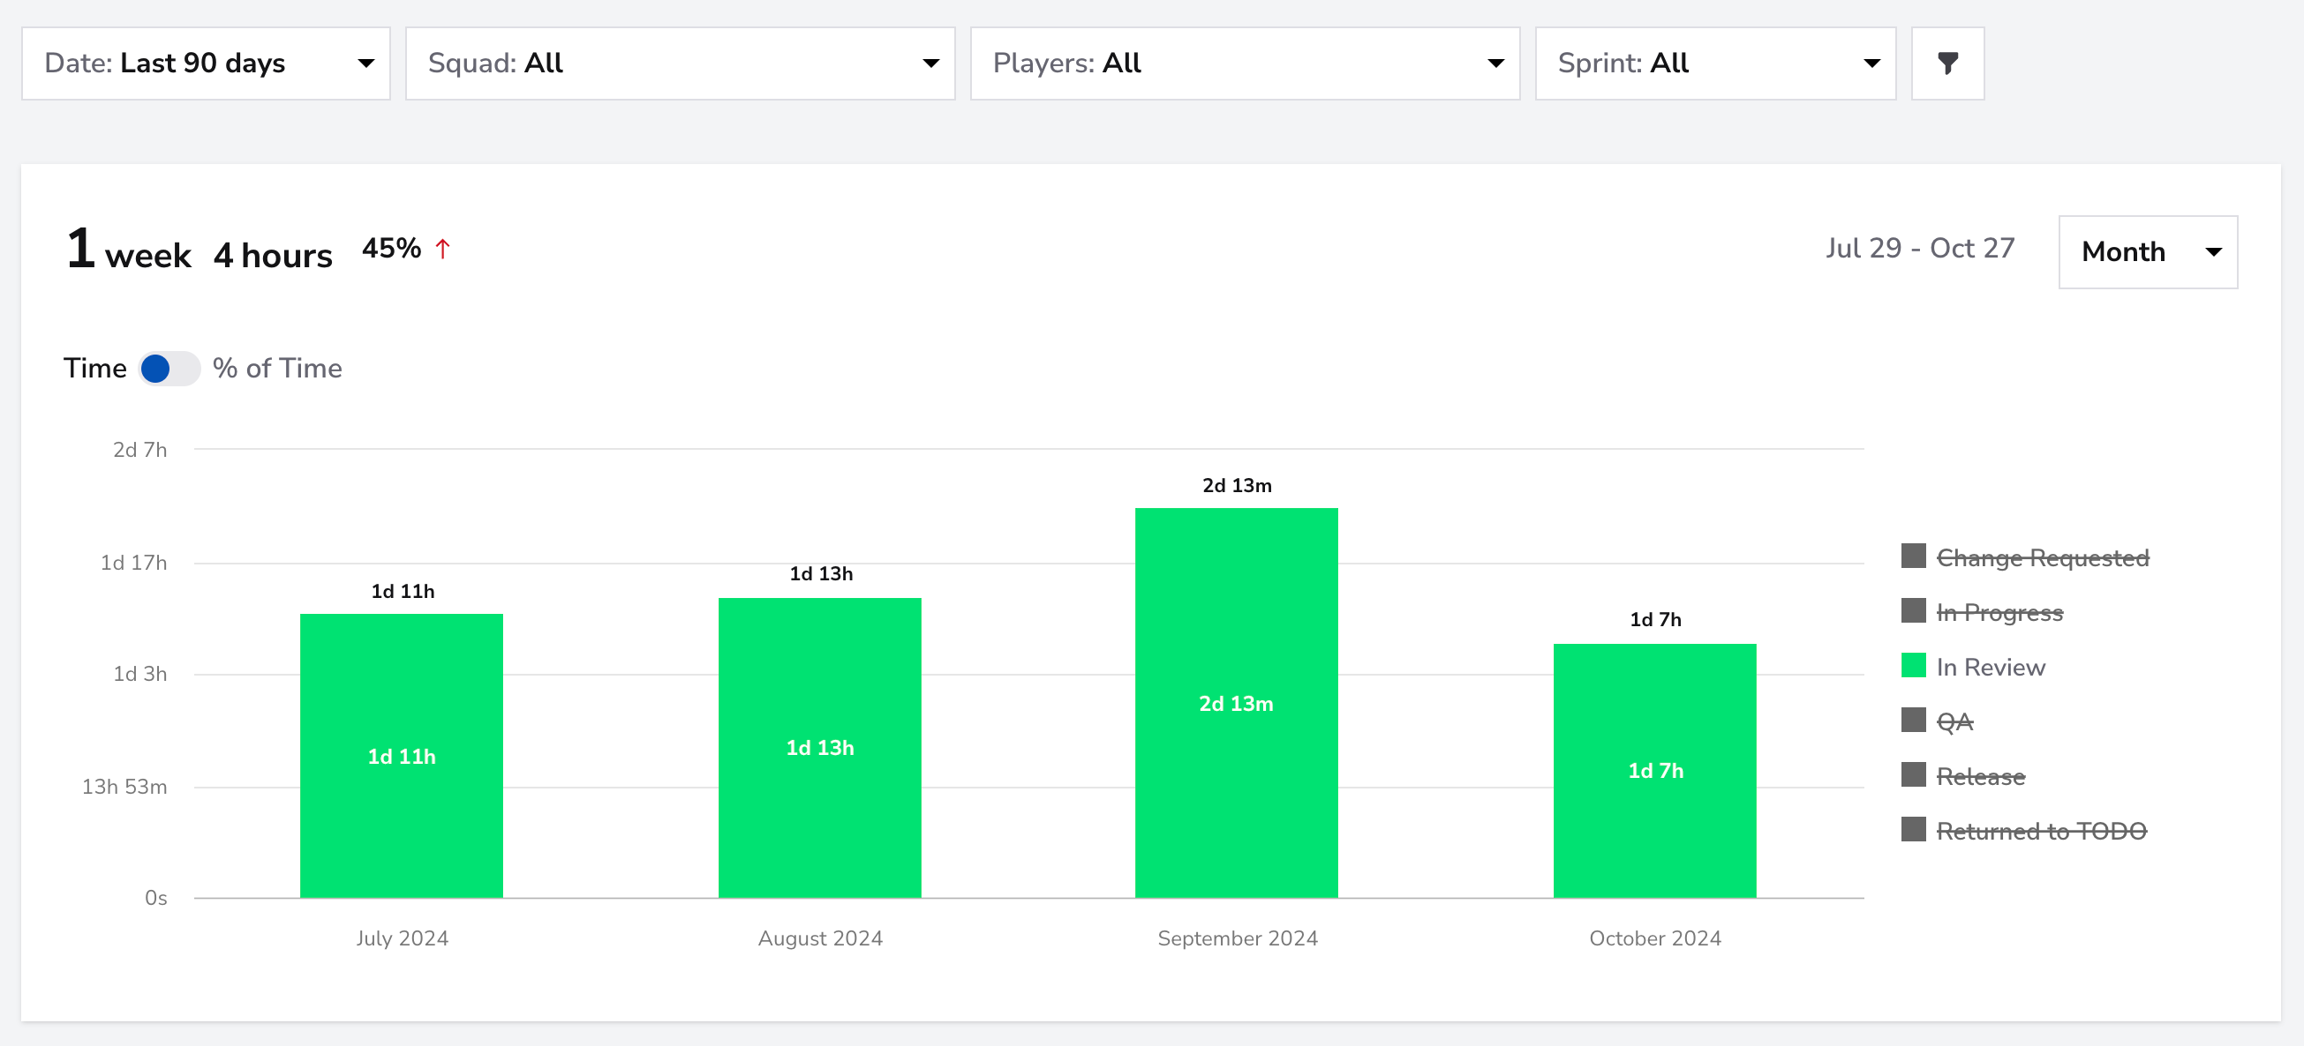
The dashboard dynamically adjusts to reflect the unique stages of your team’s kanban board, whether they are "Development," "Review," "Testing," or any other customized phases. It helps identify where time is spent and potential bottlenecks.
For example, you can click on any custom phase to review the time spent in that stage over time.
Filters
Use the Squad Filter to view the issue cycle time for individual squads. If you want a broader overview of all teams, select the "All" filter to see the issue cycle time across all squads at once.

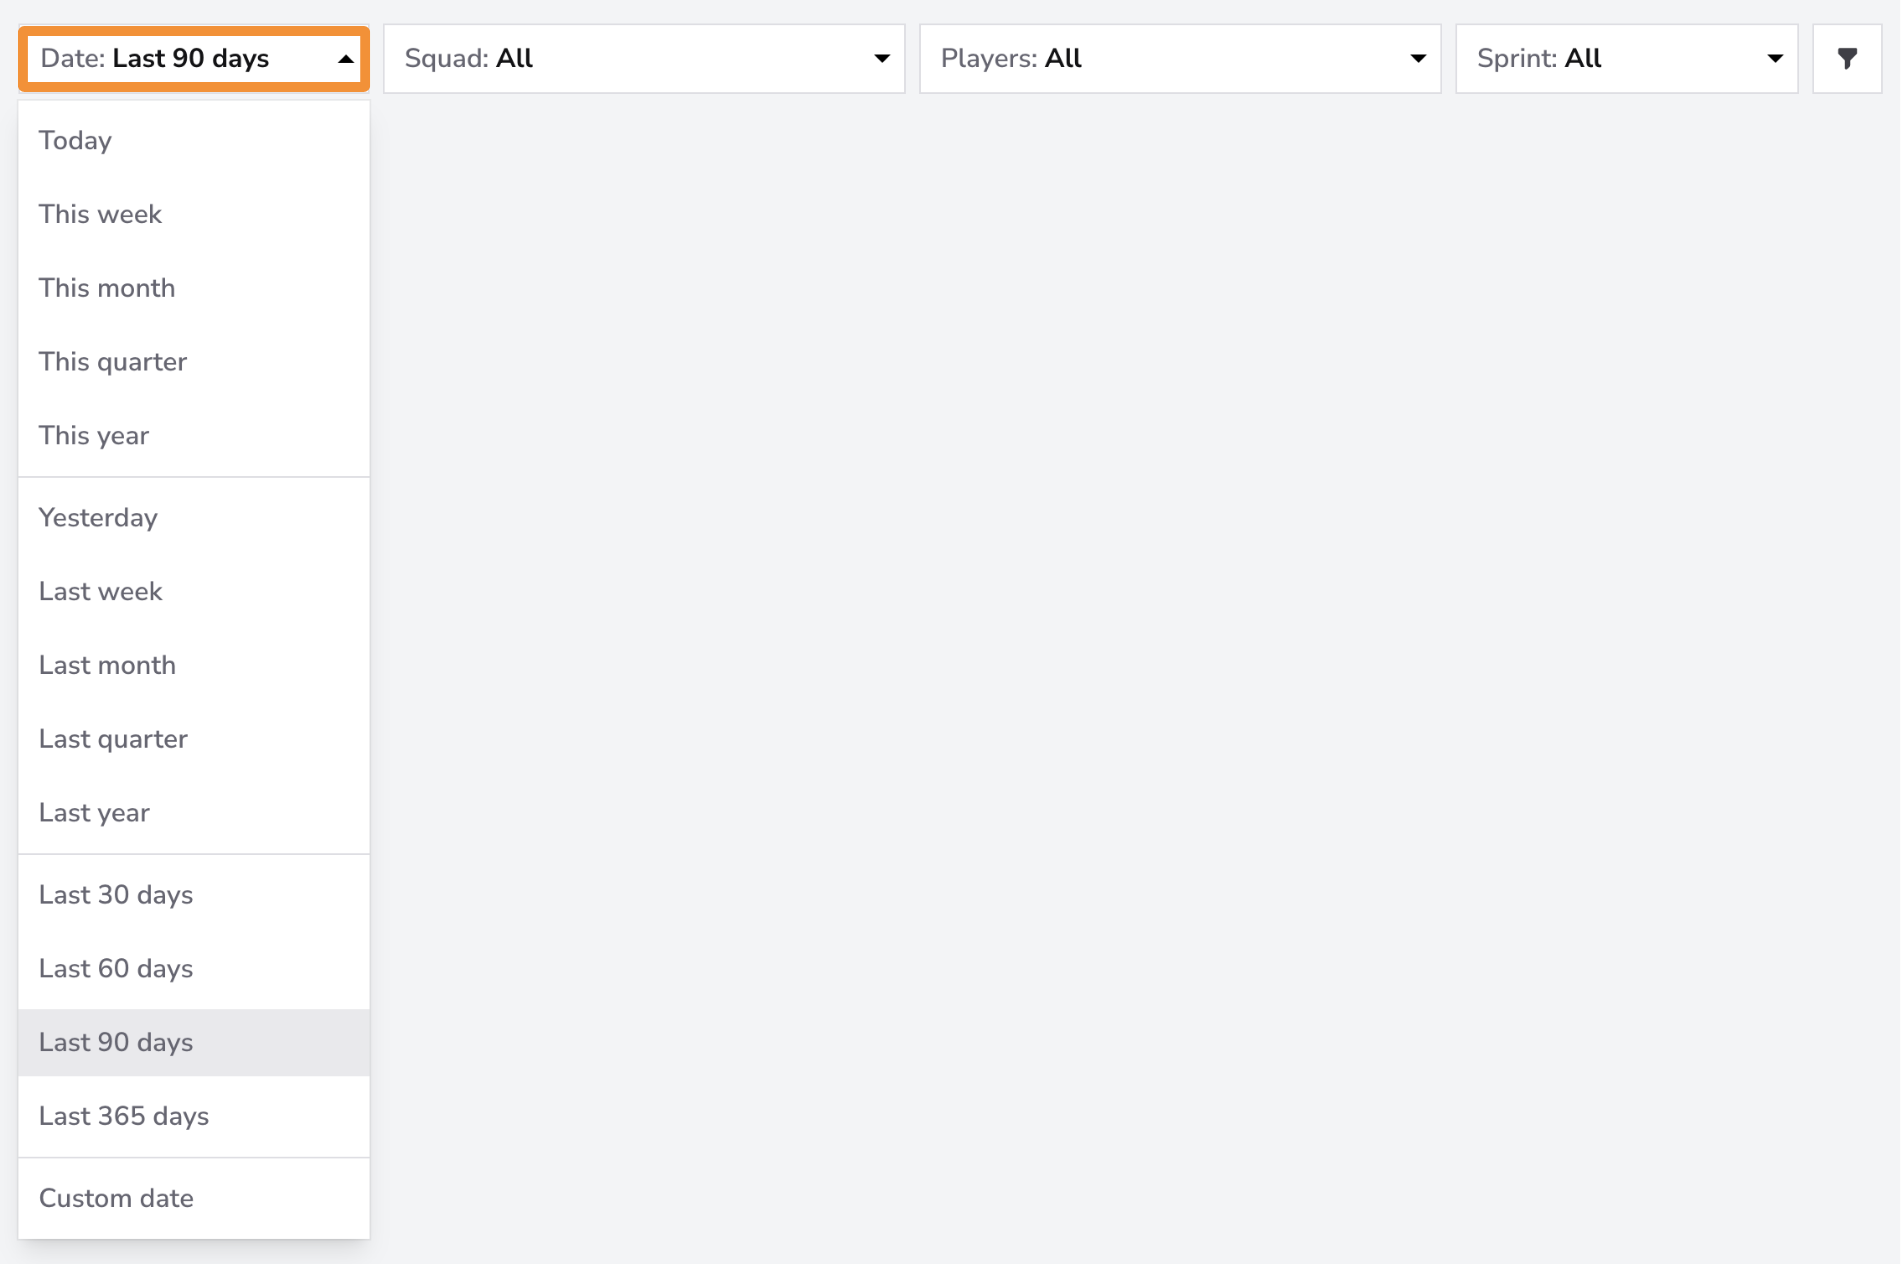
The Date Filter allows you to view data for specific time periods. You can filter for the last month, quarter, or 365 days. You can filter by a custom date range if you need more granular control.
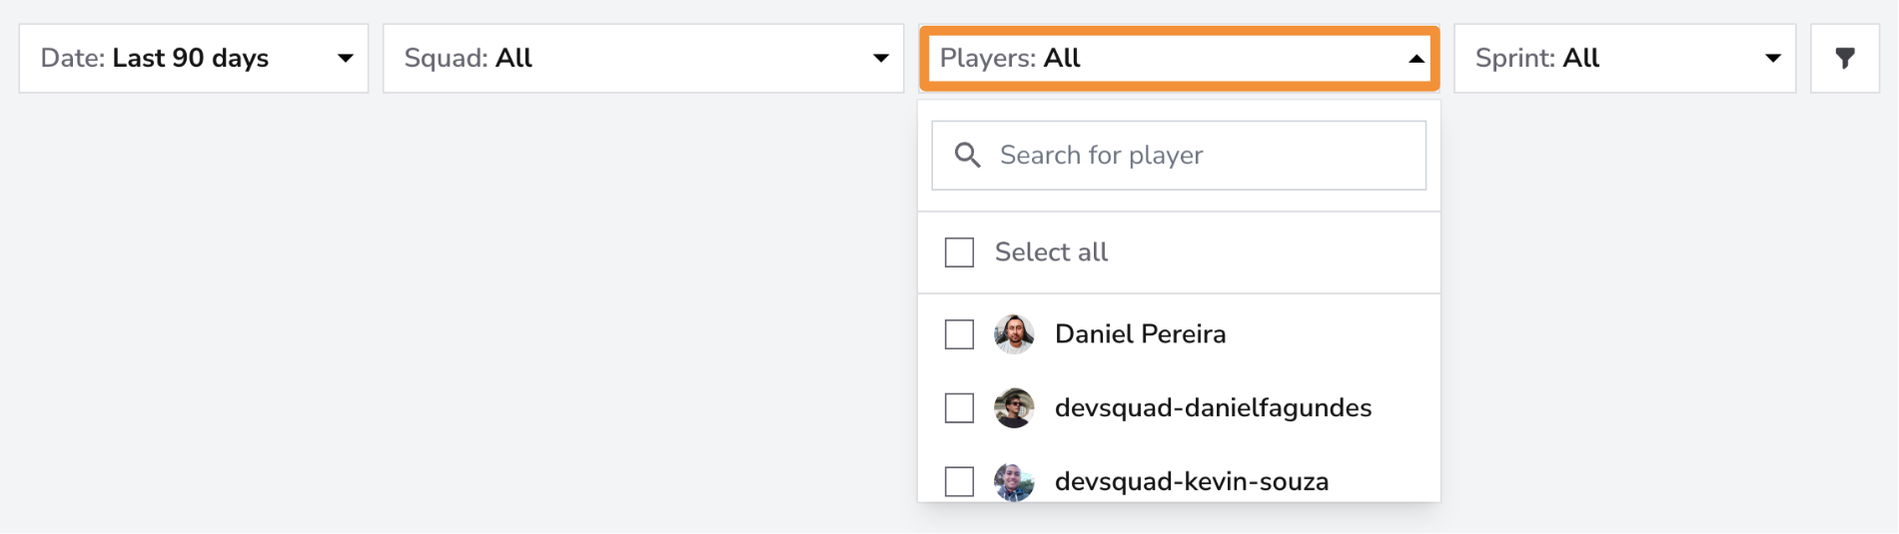
Use the Players Filter to focus on individual team members or a specific group within your squad. You can select one member for a detailed view, a group of team members if they form a sub-squad, or all team members for an overview of the entire squad's issue cycle time.
Use the Sprints Filter to focus on specific sprints or all sprints. Select individual sprints to analyze their issue cycle time in detail, or choose "All" sprints for a comprehensive overview of your team's performance across the entire sprint history.
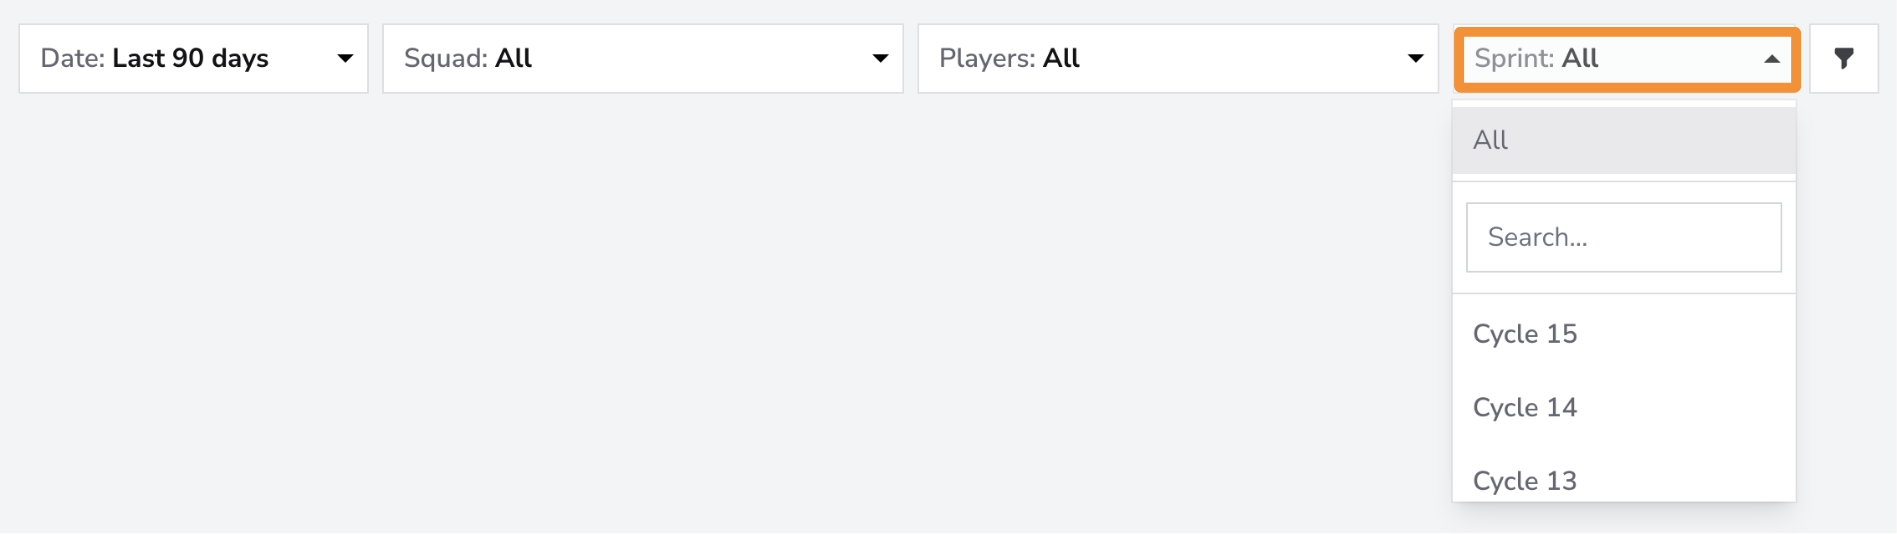
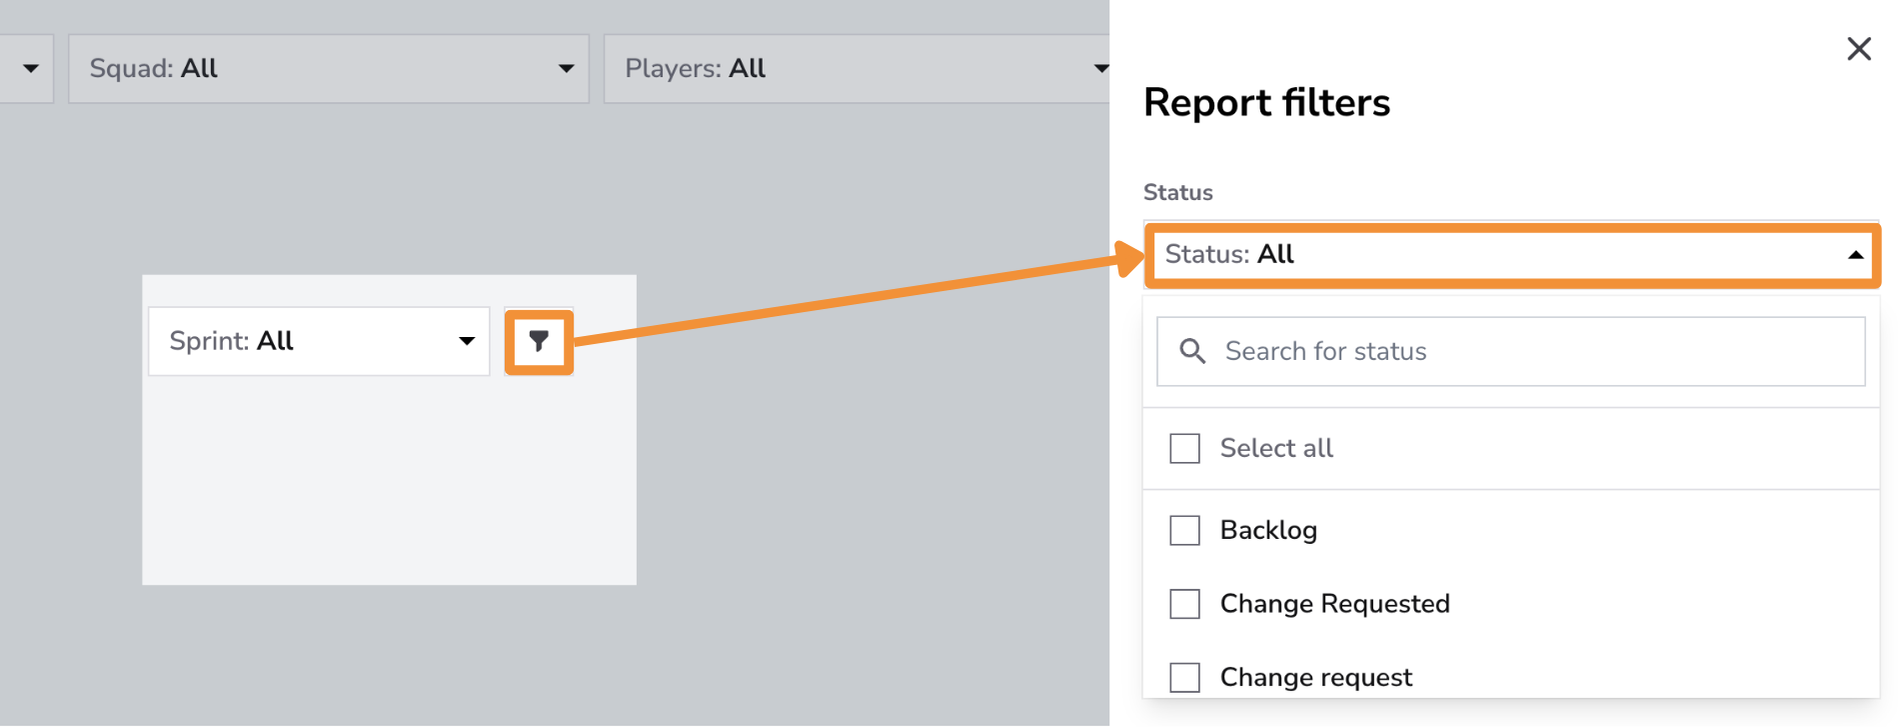
The Status Filter allows you to focus on specific stages of your workflow, such as In Review, QA, or Backlog. This filter helps you see how long issues remain in each stage, enabling you to identify any bottlenecks or delays within specific statuses.
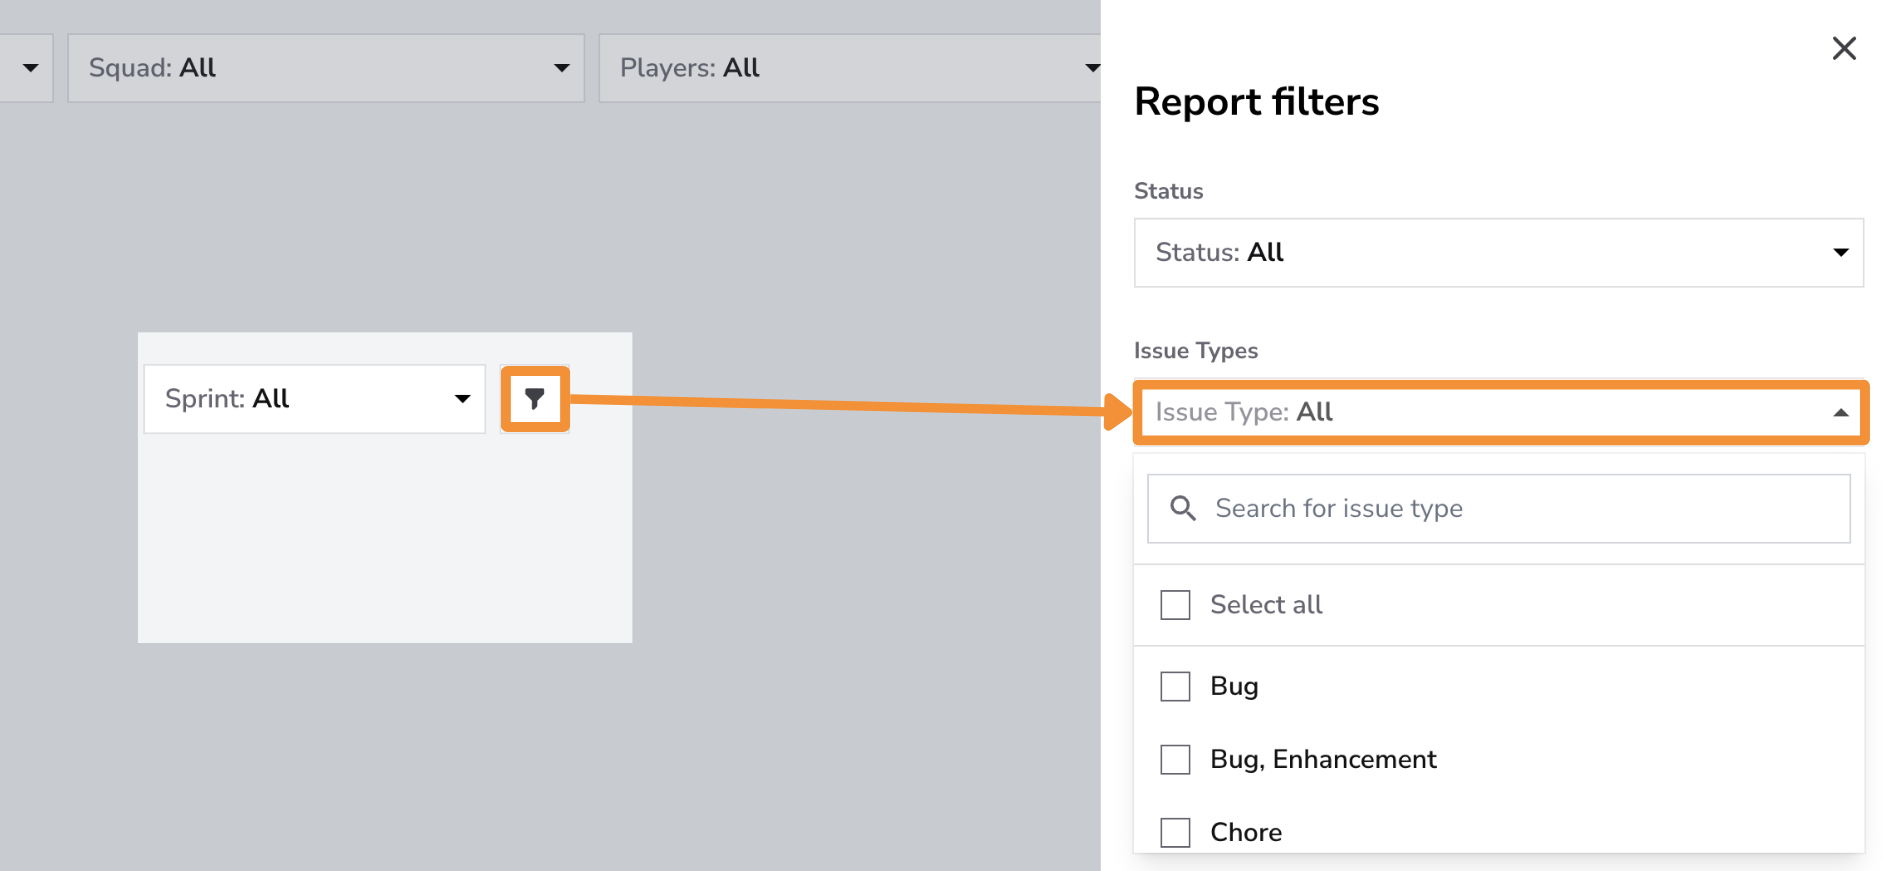
The Issue Type Filter lets you narrow down data by types of issues, such as Features, Bugs, Enhancements, or Hotfixes. This filter is useful for tracking how long it takes to move specific issue types—like hotfixes or bugs—from In Progress to Done. Monitoring these times is crucial for ensuring that critical issues like hotfixes and bugs are resolved quickly, minimizing impact on users and product stability.
Controls in the Issue Cycle Time Dashboard
Use Controls to select Average, Mode, or Percentile, and enable Trendline or Regression line. PR Cycle Time Stages is not available for this report.
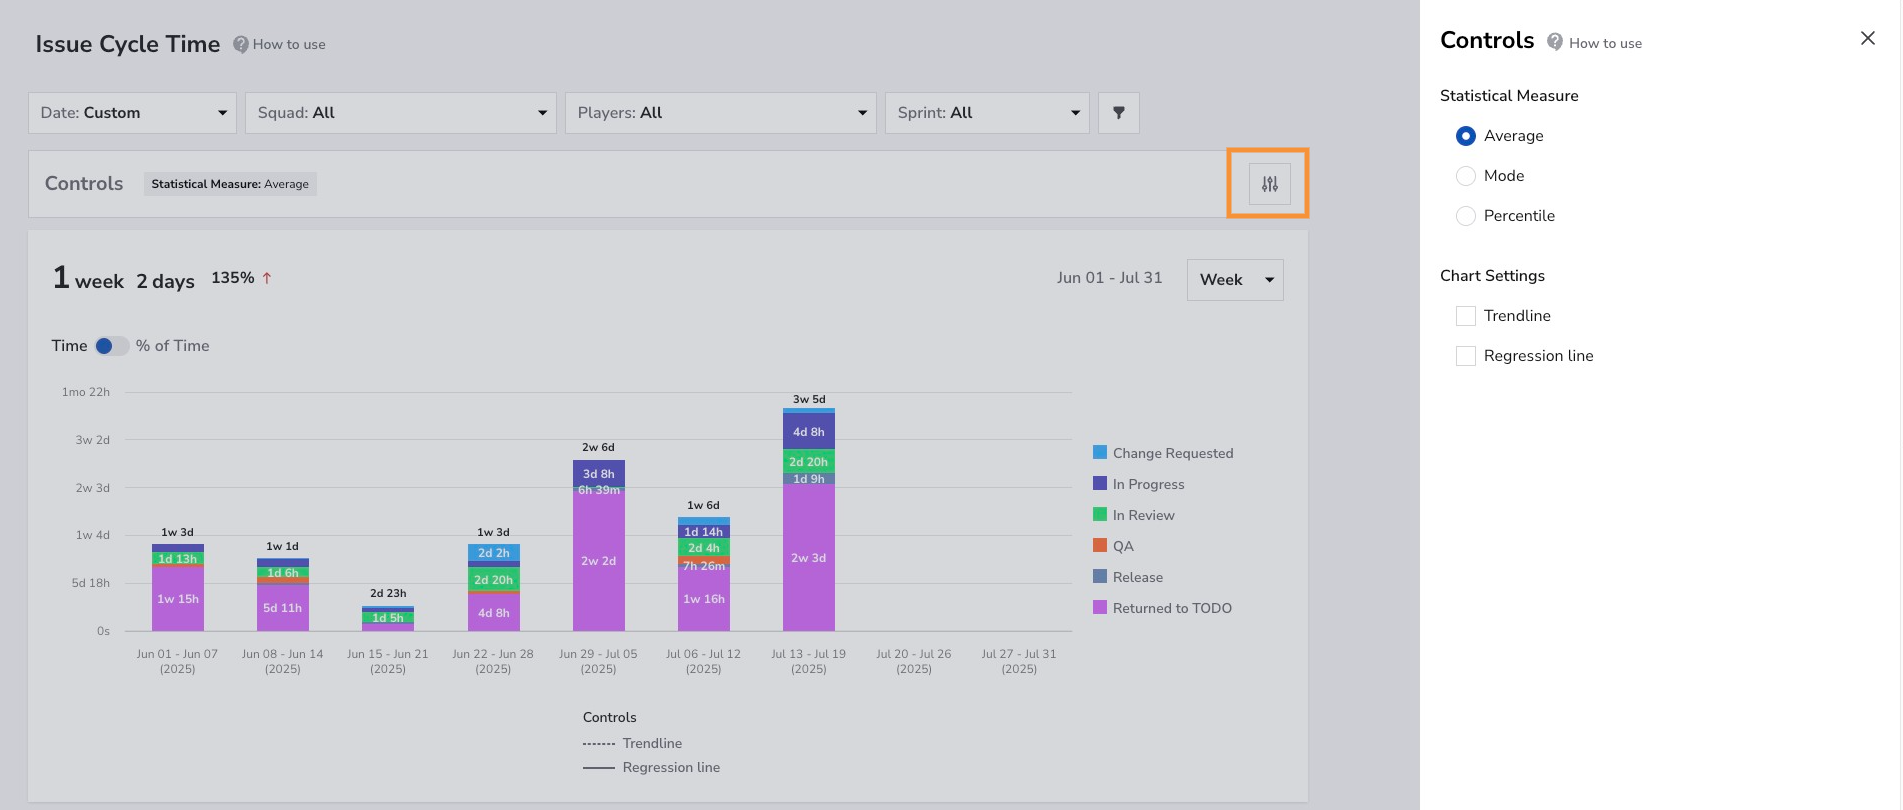
Click the adjustments button on the Controls bar and select Save after choosing your options. See the Controls guide for details.
Explore Tips
Summary
The Issue Cycle Time Dashboard is an essential tool for managing work effectively. By focusing on the flow of tasks through their various stages, teams can identify and eliminate bottlenecks, improve productivity, and deliver value faster. Remember: manage the work and emphasize finishing what you start to maintain a healthy and productive workflow.