What is the Code Quality Report?
The Code Quality Dashboard provides a comprehensive view of your codebase health by tracking key metrics that impact code maintainability, security, and reliability. It measures five critical dimensions: Bugs, Vulnerabilities, Code Smell, Test Coverage, and Duplications. This allows teams to monitor code quality trends, identify areas requiring attention, and maintain high standards throughout the development lifecycle.
The Code Quality report displays key metrics to help teams track and improve the overall health of their codebase.
Metrics
The PR Cycle Time feature displays key metrics to help teams track and optimize each phase of the pull request lifecycle.
Bugs
- What: Bugs represent code issues that can cause unexpected behavior or runtime errors. This metric counts the number of identified bugs in your codebase.
- Why it matters: Bugs directly impact software reliability and user experience. Tracking bugs helps teams prioritize fixes, prevent issues from reaching production, and maintain a stable codebase. A lower bug count indicates higher code quality and fewer potential runtime problems.
- How to use it: Monitor the bug count and trend to identify patterns. A rising trend may indicate code complexity, insufficient testing, or technical debt accumulation. Use this metric to prioritize bug fixes and allocate resources for code quality improvements.
- User interface:
Vulnerabilities
- What: Vulnerabilities are security weaknesses in your code that could be exploited by malicious actors. This metric tracks the number of security issues detected in your codebase.
- Why it matters: Security vulnerabilities pose serious risks to your application, data, and users. Identifying and addressing vulnerabilities quickly is essential for maintaining a secure product and protecting sensitive information. Lower vulnerability counts indicate stronger security posture.
- How to use it: Regularly review vulnerability reports and prioritize fixes based on severity. Critical vulnerabilities should be addressed immediately. Track trends to ensure your security practices are effective and vulnerabilities aren't accumulating over time.
- Example: If you have 7 vulnerabilities with a 12% decrease, this suggests your security practices are improving. Continue monitoring to maintain this positive trend.
- User interface:
Code Smell
- What: Code Smell refers to code characteristics that indicate potential design or implementation problems. These aren't bugs but rather patterns that make code harder to understand, maintain, or modify. This metric counts the total number of code smell instances in your codebase.
- Why it matters: High code smell counts indicate technical debt and reduced code maintainability. While code smells don't cause immediate failures, they slow down development, increase the likelihood of bugs, and make future changes more difficult and risky. Addressing code smells improves long-term development velocity.
- How to use it: Monitor code smell trends to assess technical debt accumulation. A rising trend suggests development practices need improvement. Use this metric to identify refactoring priorities and maintain code quality standards. Break down large code smell counts by severity or category to focus efforts effectively.
- Example: A code smell count of 300 with a 24% increase indicates growing technical debt. Consider allocating time for refactoring efforts to prevent further degradation.
- User interface:
Test Coverage
- What: Test Coverage measures the percentage of your codebase that is covered by automated tests. It indicates how much of your code is executed during test runs.
- Why it matters: Higher test coverage generally correlates with fewer bugs and more confident code changes. Good test coverage enables safer refactoring, faster bug detection, and more reliable deployments. It provides confidence that code changes won't introduce regressions.
- How to use it: Track test coverage trends to ensure new code includes appropriate tests. Set team standards for minimum coverage levels (e.g., 80% or higher). Identify untested critical paths and prioritize adding tests for high-risk areas. However, remember that coverage is a guideline, not a guarantee—focus on meaningful tests, not just achieving percentage targets.
- Example: A test coverage of 89% with a 48% increase shows excellent progress in testing practices. Continue this momentum to maintain code reliability.
- User interface:
Duplications
- What: Duplications measure the percentage of code that is duplicated or copied across your codebase. This metric identifies repeated code blocks that could be consolidated.
- Why it matters: Code duplication increases maintenance burden and bug risk. When duplicated code needs updating, changes must be made in multiple places, which increases the chance of inconsistencies and errors. Reducing duplication improves maintainability and makes the codebase more efficient.
- How to use it: Monitor duplication percentages to identify refactoring opportunities. Look for patterns in duplicated code and extract common functionality into reusable components, functions, or modules. Set team standards for acceptable duplication levels (typically under 5%).
- Example: A duplication rate of 3% with a 35% increase suggests growing copy-paste development. Review recent code changes to identify and consolidate duplicated logic.
- User interface:
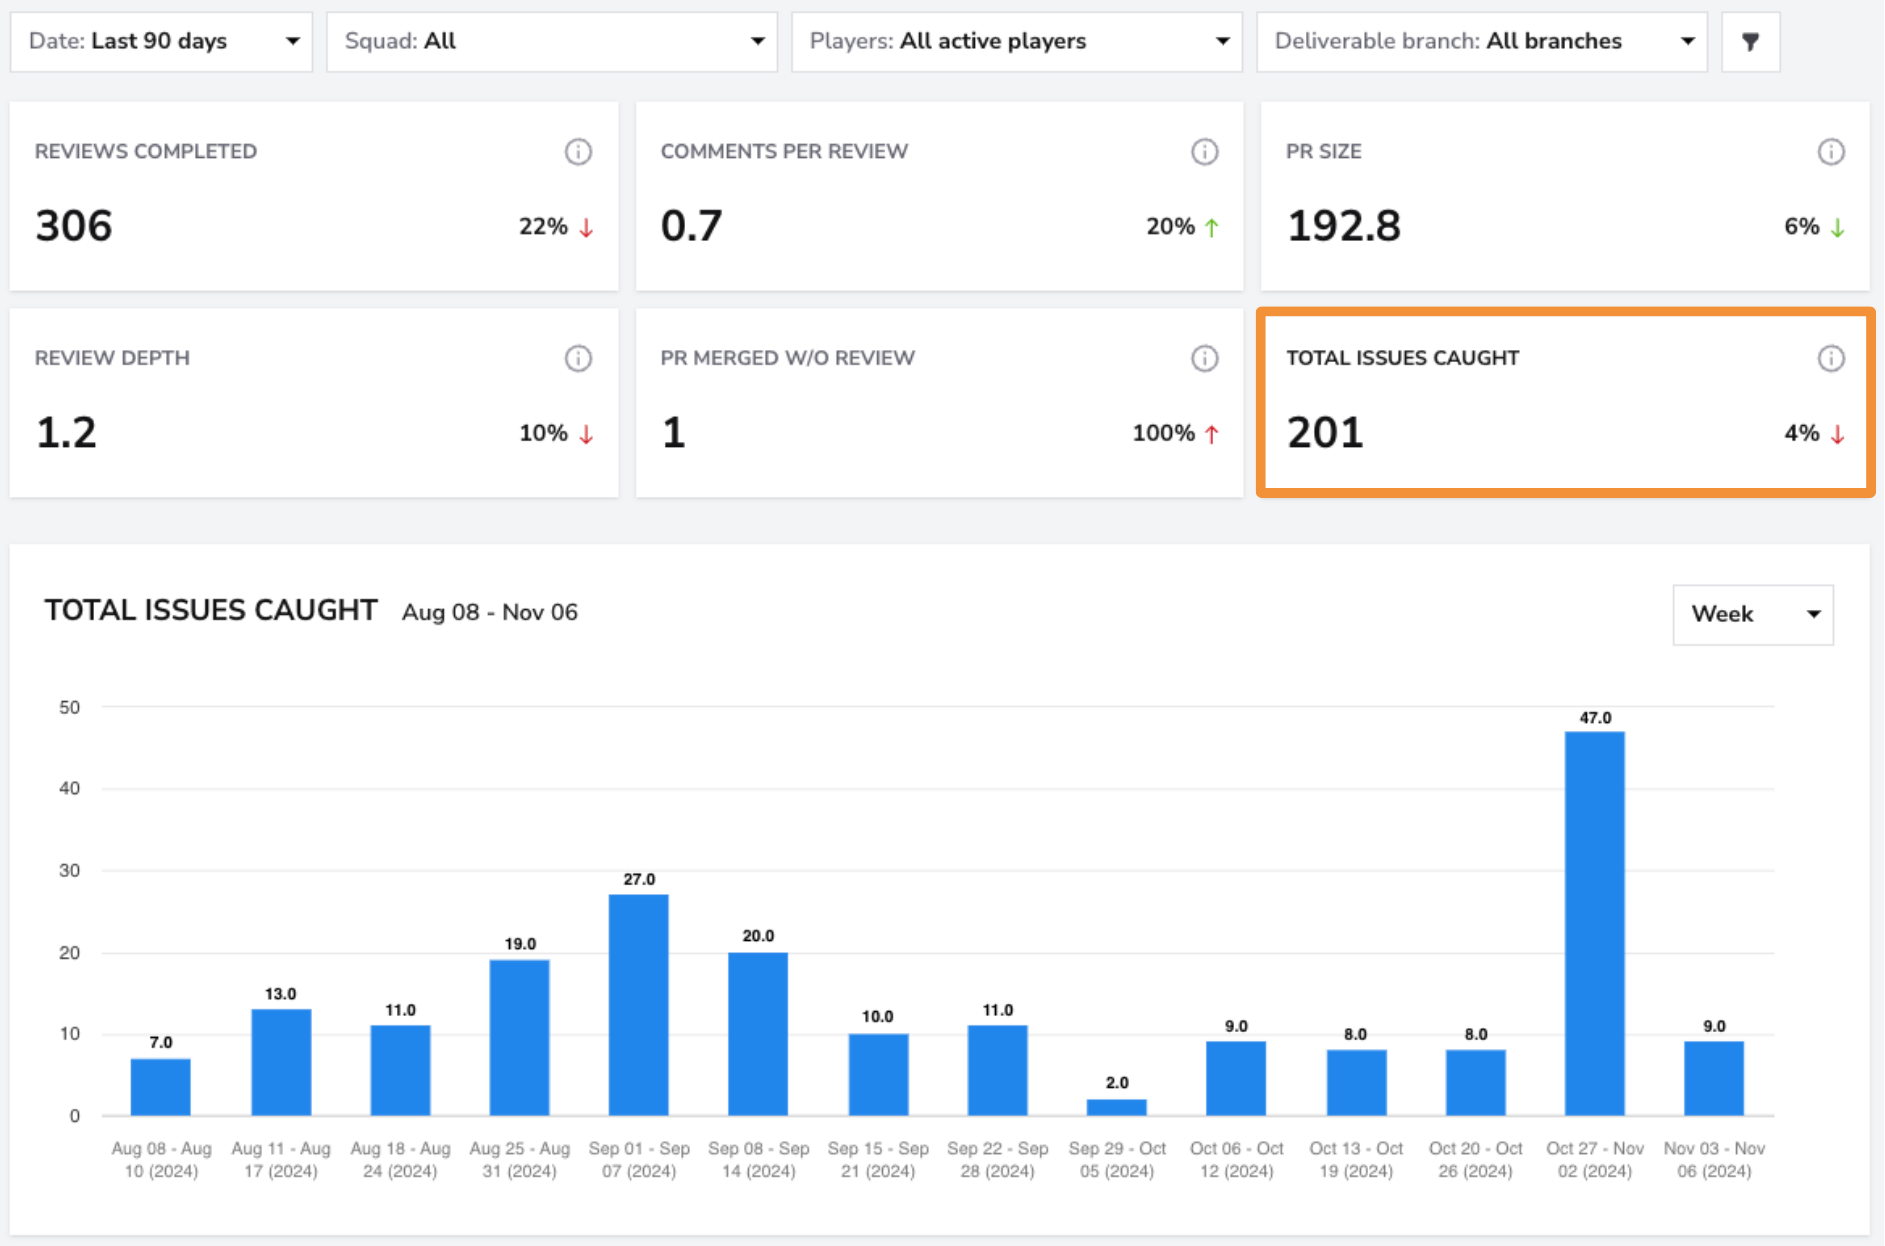
Code Quality Dashboard
The Code Quality feature includes a trend chart that visually represents metric evolution over time. The chart shows bug trends from the selected date range, helping teams identify patterns and track improvement efforts. Below the chart, you can find a detailed list of all bugs with their severity levels (Minor, Major, Critical) and status.
Each metric card displays the current count or percentage along with the trend indicator showing whether the metric is improving or degrading compared to the previous period. Green arrows indicate positive trends (decreasing bugs, vulnerabilities, duplications, or increasing test coverage), while red arrows indicate areas needing attention.
Filters
Use the Squad Filter to view PR Cycle Time metrics for individual squads. If you want a broader overview of all teams, select the "All" filter to see the breakdown across all squads at once.

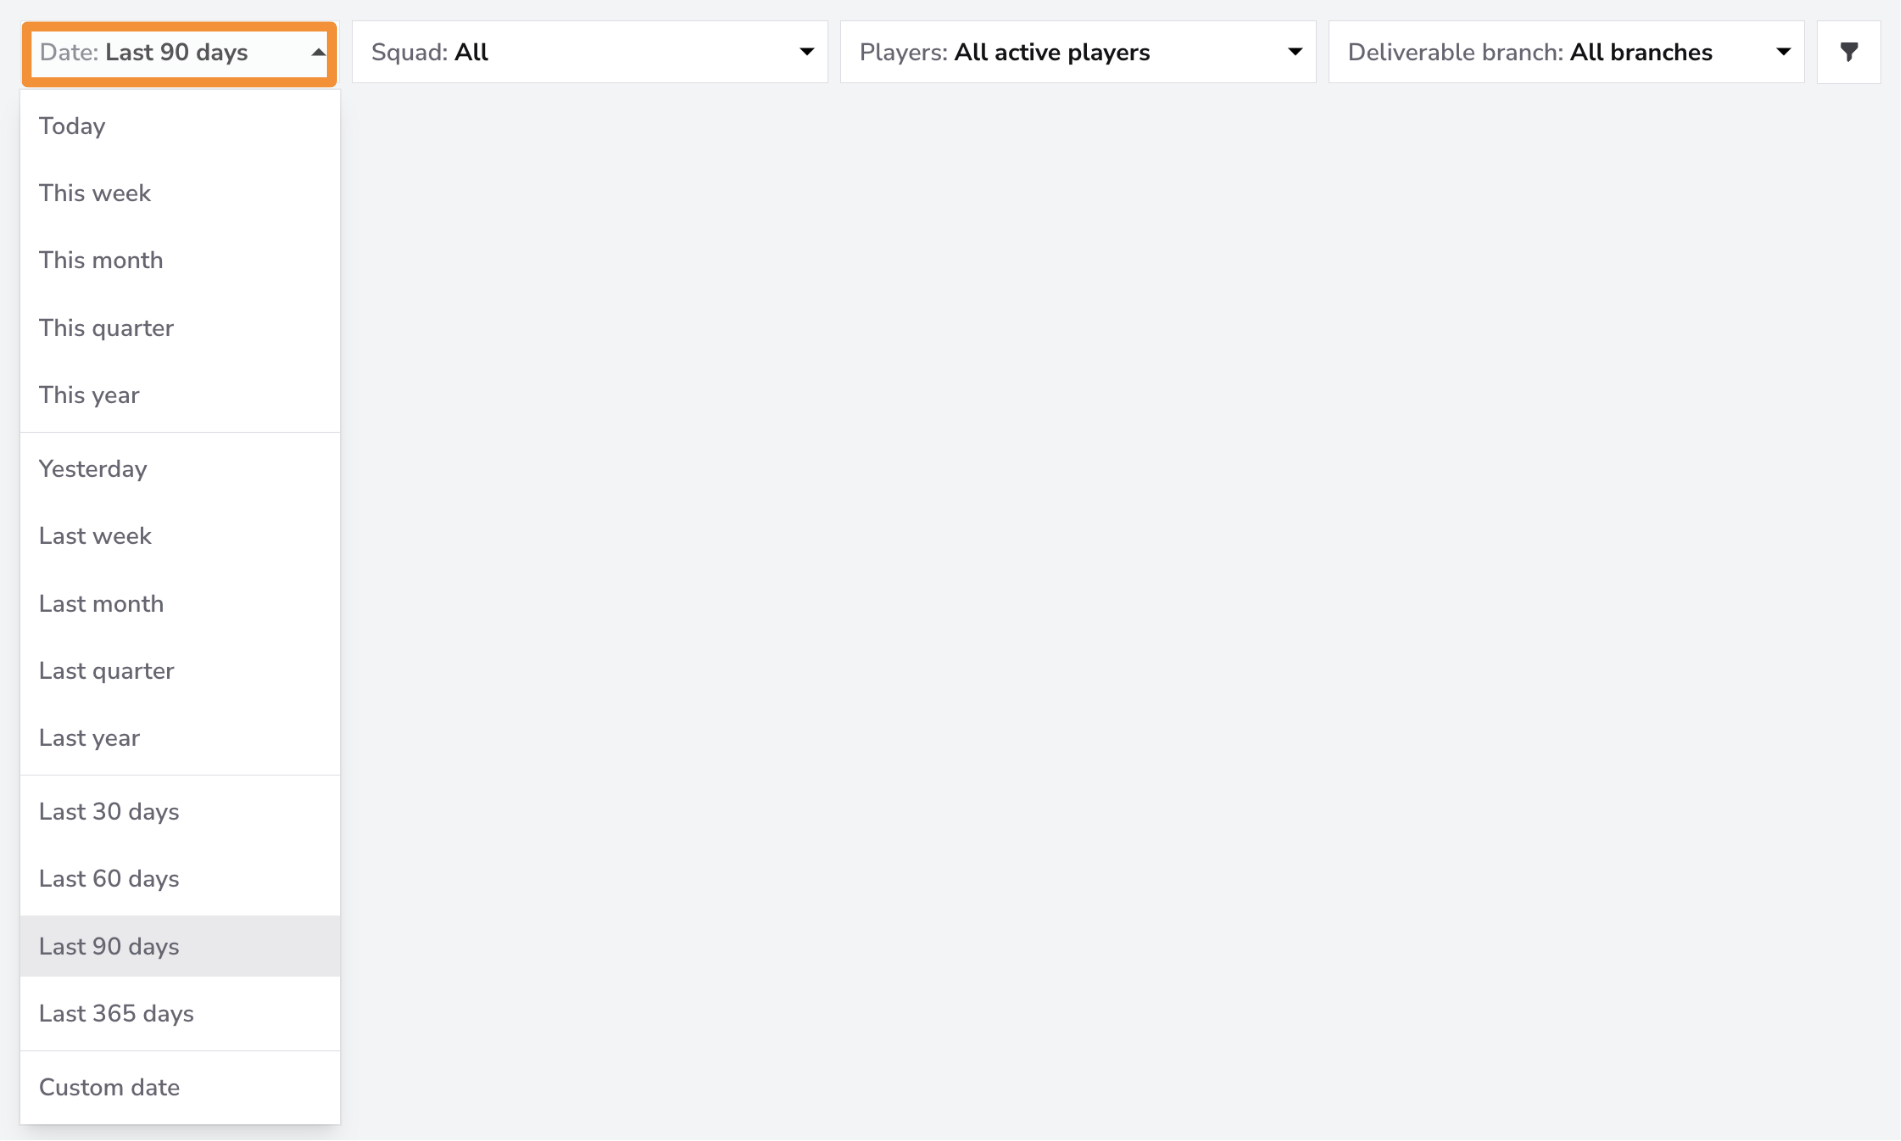
The Date Filter allows you to view data for specific time periods. You can filter for the last month, quarter, or 365 days. If you need more granular control, you can filter by a custom date range.
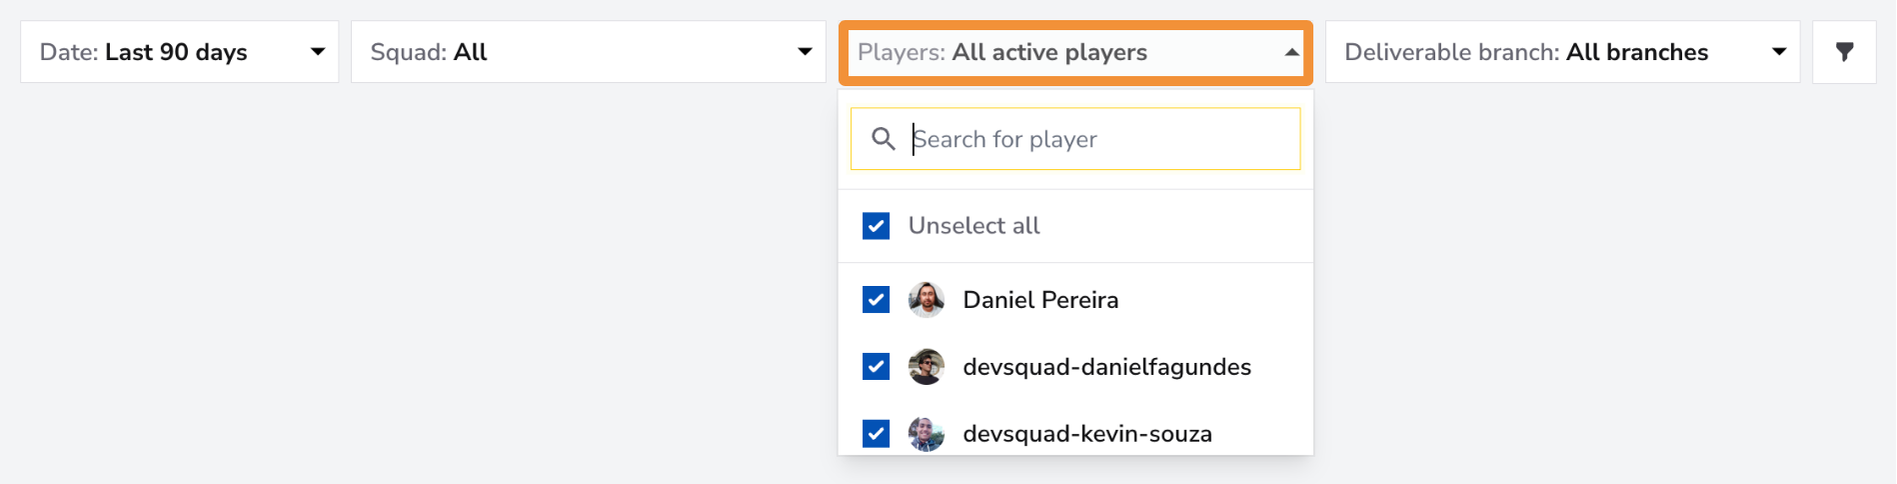
Use the Players Filter to focus on individual team members or a specific group within your squad. You can select one member for a detailed view, a group of team members if they form a sub-squad, or all team members for an overview of the entire squad's PR Cycle Time metrics.
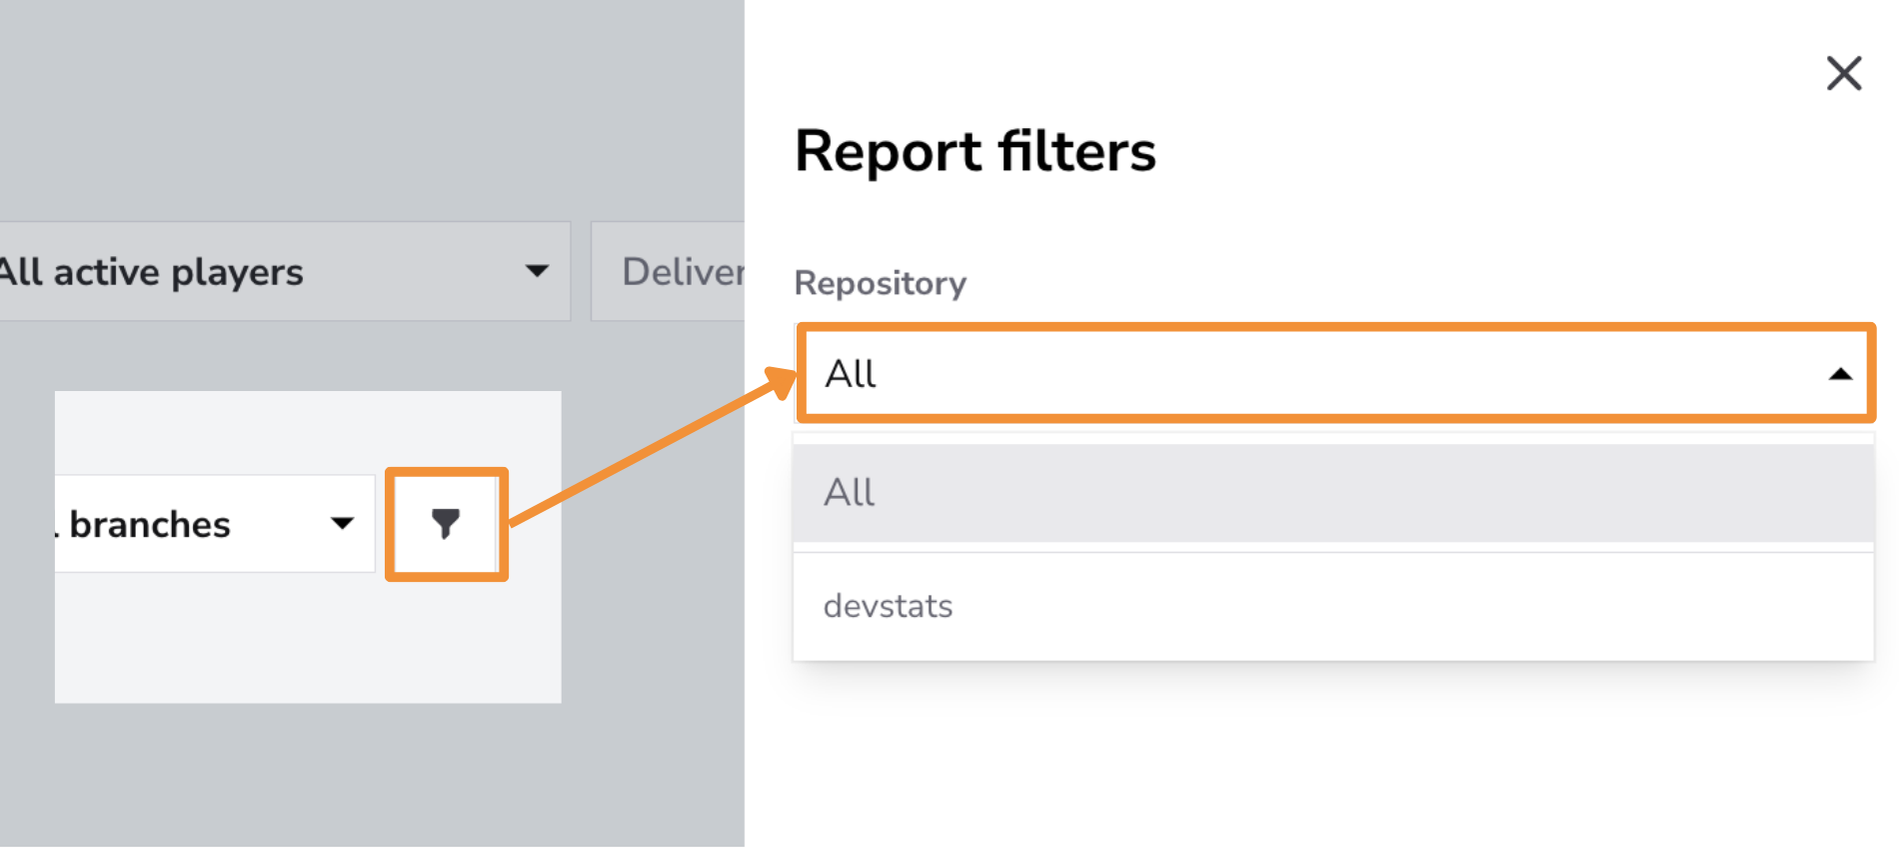
Use the Repository Filter to focus on specific repositories or view PR Cycle Time metrics across all repositories. This filter is particularly useful for isolating patterns and performance in individual codebases, especially when working across multiple repositories. Examining PR Cycle Time by repository allows you to identify bottlenecks, optimize review and deployment practices, and ensure consistency in workflows across different parts of your codebase.
Controls
In this report, Controls offers Chart Settings only: enable Trendline or Regression line to inspect patterns in the chart. Statistical Measure and PR Cycle Time Stages are not available; these options do not change how the report metrics are calculated.
Click the adjustments button on the Controls bar and select Save after choosing your options. See the Controls guide for details.
Conclusion
The Code Quality Dashboard is a powerful tool for monitoring and improving the health of your codebase. By tracking Bugs, Vulnerabilities, Code Smell, Test Coverage, and Duplications, teams can maintain high quality standards, reduce technical debt, and deliver more reliable software. Regular monitoring of these metrics enables proactive quality management and helps teams make data-driven decisions about code improvements.